


Last Updated on August 12, 2026 by Ewen Finser
If you’re looking to start or improve an affiliate program for your SaaS company, you’ve probably tried to Google benchmarks for something like “good affiliate conversion rate” and come up empty, or worse, tried to apply ecommerce stats to your software business. But as you know, ecommerce and SaaS are two very different playbooks, so you need numbers that take your industry into consideration.
Success with a SaaS affiliate program doesn’t come down to one magic number; it’s about finding the right benchmarks for a recurring-revenue model and then measuring them well enough to act on them.
Why SaaS Affiliate Benchmarks are Different

It’s a bad idea to try to apply ecommerce or other industry affiliate benchmarks to SaaS because the business models are just so different. SaaS tends to operate with recurring revenue, free trials, longer sales cycles, and expansion revenue, whereas ecom brands usually operate on first-sale metrics. But if you’re only taking the first sale into account, you’re underselling the channel in a big way. This is why it’s so important to have a partner marketing platform that offers full-funnel tracking and the ability to see lifetime value of a sale overall.
The SaaS Affiliate Program Benchmarks that Matter
There are two types of benchmarks that matter to your program: performance benchmarks and design or industry norm benchmarks, so I’ve broken this list into those two categories to help you find what you’re looking for.
Performance Metrics

Performance metrics for SaaS have to take the full funnel into account, so we can’t just look at a single conversion rate and hope for the best. Instead, focus on tracking these numbers:
Partner activation rate
The median partner activation rate for SaaS affiliates, according to a meta study by TrackRev, is 18%; that’s the percentage of affiliates who drive at least one sale within the first 30 days. This is important because it distinguishes the vanity metric of your affiliate recruitment numbers from real supply of producing affiliates. It’s important to look at your own numbers over time before comparing them to any external benchmarks. A low rate can indicate bad recruiting or bad onboarding, but the number alone won’t tell you which.
Active-partner ratio
A related figure to watch is your active-partner ratio: the share of affiliates producing within a given window of time. A healthy active-partner ratio is 3 or 4 out of 10, or 30–40% in 90 days. Be sure to define your active window explicitly and take the length of your own sales cycle into account.
Revenue concentration
Your revenue concentration is how much of your program’s revenue comes from your top performers. This number measures the health of your program; it’s not a growth metric. The top 25% of affiliates typically drive as much as 89% of program revenue. The risk here is when a very small number of affiliates drive a very large percentage of revenue, because if one of them quits promoting for any reason, your revenue drops by an outsized amount.
Click-to-trial and trial-to-paid signup rates
If you have a free trial in your funnel, it’s important to track both pieces of it: the clicks to sign up for the free trial, and then the conversion from trial to paid.
A good click-to-trial conversion rate is around 4.5%. But those numbers change depending on how you set up your funnel. Freemium products have a higher conversion rate at around 9%, and trials that require a credit card drop to 3.5% conversion rate.
From there, the trial-to-paid conversion rates are similarly varied. If you just look up an overall average, the conversion rate is around 8%; but ChartMogul’s research suggests almost nobody actually sits at 8%. A regular free trial sits at around 4–5%; freemium models average 7–9% conversion rates; and trials that require a credit card sit at a whopping 25–35% conversion rate. So the structure of your funnel matters a lot.
Blending these two stages into one overall conversion rate really doesn’t help you understand where your funnel is working and where it may be struggling. Another good reason it’s important to have clear data at all stages of your funnel.
Industry norm benchmarks

The second set of benchmarks you may be interested in are industry norms for things like commission rates and cookie windows.
Commission structure
Commission structure covers things like recurring commissions vs. a flat or one-time commission, etc.
Most SaaS affiliate programs, 39%, use a 6- or 12-month fixed recurring term, meaning they pay a monthly commission for a fixed period of time, even if the customer ultimately stays longer. Thirty-three percent use a one-time payment commission structure, and only 18% pay a lifetime recurring commission.
Cookie window
The cookie window for an affiliate program is how long an affiliate’s cookie stays active to attribute them the sale. The median for SaaS companies is a 60-day cookie window; however, different types of programs tend to use different attribution windows. B2B SaaS programs with free trials, for example, tend to use longer 90-day windows, most likely because their sales cycles are longer.
Commission rate
The average commission rate for B2B SaaS companies is 20% while B2C SaaS is closer to 15%. (This data excludes programs that pay a flat rate.) But that average is a little misleading; there’s no one average when you consider that the entire SaaS market consists of some $9 a month products and some that cost $50,000 a month.
The right structure for you is a model choice, not a particular number to hit, and these norms are just a starting point. You’ll want to set your commission rate based on the long-term value of your customer.
Long-term Value: The SaaS Differentiator

Because SaaS models typically rely on recurring revenue, the long-term value of a customer and affiliate partnership are the unique differentiating factors for your affiliate or referral program.
CAC
Your CAC is your customer acquisition cost for an affiliate referral, and it’s especially important to consider as compared to the CAC for other channels (ads, organic, etc.). Referral and affiliate programs tend to have some of the lowest CACs for SaaS, averaging around $150.
LTV
The average lifetime value of your customers will be a purely internal number depending on the cost of your software and how long you tend to retain your customers.
LTV to CAC ratio
This ratio is often used to calculate the amount of commission you can comfortably pay without affecting your margins. That is, the lifetime value of a customer must be more than the total commission paid plus any additional costs of acquisition (ie: cost of attracting the partner). An LTV to CAC ratio of 3 to 1 or better is considered healthy. If a higher or recurring commission rate would push your blended customer acquisition cost beyond average lifetime value, it’s too high.
Your LTV to CAC ratio is the most important number that settles the question of whether or not your program is actually working and whether your program is providing a strong ROI.
Why Your Benchmarks are Probably Wrong: Measurement
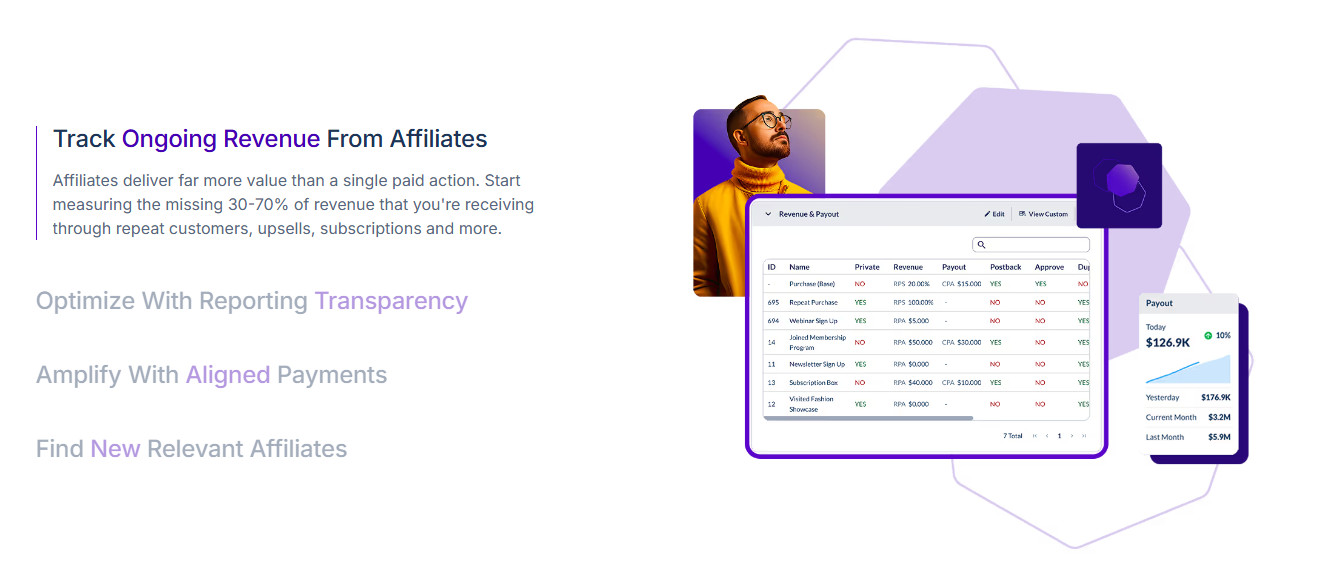
Most affiliate and partner marketing platforms are simply not set up to handle the complexities associated with SaaS funnels and business models, and so they aren’t tracking the numbers you actually need to know. Some can’t accommodate recurring commission payments, or commissions that change over time. Some don’t track full-funnel attribution, so they miss parts of your funnel altogether.
For example, many affiliate program management tools rely on last-click attribution, but that can deeply undercount partner-influenced and post-purchase or expansion revenue. Partner marketing platform Everflow suggests that post-purchase revenue tracking can unlock visibility into an additional 30–70% of revenue that traditional last-click models miss.
In addition, if your partner tracking platform isn’t set up to track every stage of your funnel, you’ll miss out on important numbers like understanding trial-to-paid conversions, your partner revenue concentration, and that important LTV to CAC ratio.
A platform like Everflow, which is specifically designed to track the complete user journey across your full customer lifecycle, is important. But remember: better tracking and data isn’t a replacement for strategy; it just gives you the numbers to guide it.

Everflow makes partner management simple, fast, and transparent. Real-time data, clean reporting, and tools built for affiliate managers who want to scale with confidence.
Common Mistakes to Watch For

The biggest mistake you can make in looking at your SaaS affiliate program numbers is to compare them to the wrong benchmarks. As I think I’ve demonstrated above, averages can be misleading and the benchmarks can vary widely between business models, audiences, and products.
The second biggest mistake you can make is only tracking top-line “conversion” numbers, whether because your affiliate program software doesn’t have full visibility into your funnel or because you think that top-line number is the only one that matters; it isn’t.
Additionally:
- Don’t chase partner volume over partner quality. Your top performers can drive a significant portion of your overall revenue, as evidenced by the revenue concentration numbers.
- Don’t default to a last-click attribution model. Everflow’s data shows that if you do, you could be missing visibility into up to 70% of your revenue.
- Don’t default to a flat commission in a recurring revenue model. Flat commission rates were designed for ecom single purchase models, not a recurring revenue model. Your LTV to CAC ratio should drive your affiliate commission decisions.
- Don’t look for the “right” benchmarks or models. There isn’t a single right answer. The right model is the one that’s right for your business.
Reframing What “Good” Actually Looks Like for SaaS Affiliate Programs

Benchmarks only take you so far, and SaaS programs in particular vary widely both from traditional ecommerce, but also between different types of programs, audiences, and funnels.
The key is to measure your own numbers correctly with a tool that can show you the entire funnel, read those numbers in the right context, and then strive to improve against your own baseline.