
There is so much businesses can learn about their customers today. With all of the data that’s available, businesses can get serious insight into customer behavior and predict their needs. Companies that make it a priority to collect and analyze this data are major competitors in their field. Since analytics technology is always changing and advancing, the smartest companies are regularly enhancing their data collection capabilities.
Depending on the company – its size, audience, life stage and goals – the data analytics suite that’s the best fit may be different from what the company across the street is using. Choosing the right data analytics suite for you is a two-part process.
- First, you have to understand your own business, specifically your needs and goals.
- Second, you have to know how to evaluate the analytics providers out there. In order to deal with your many business and marketing challenges, the analytics tools you choose should be adaptable, flexible and mobile-friendly.
In this article, we’ll start by giving you an overview of data analytics software. We’ll then discuss the questions you need to ask about your business in order to pick the best software out there, including how much data and what type of data you plan on tracking. Then, we’ll get into the various features to keep an eye out for and the metrics you may want to track. While this isn’t an exhaustive list, it does hit the main players that many online businesses are most interested in. We also have a section with five of the biggest mistakes businesses making with their analytics, followed by a Final Thoughts section where we’ll wrap up.
What is Data Analytics Software? An Overview
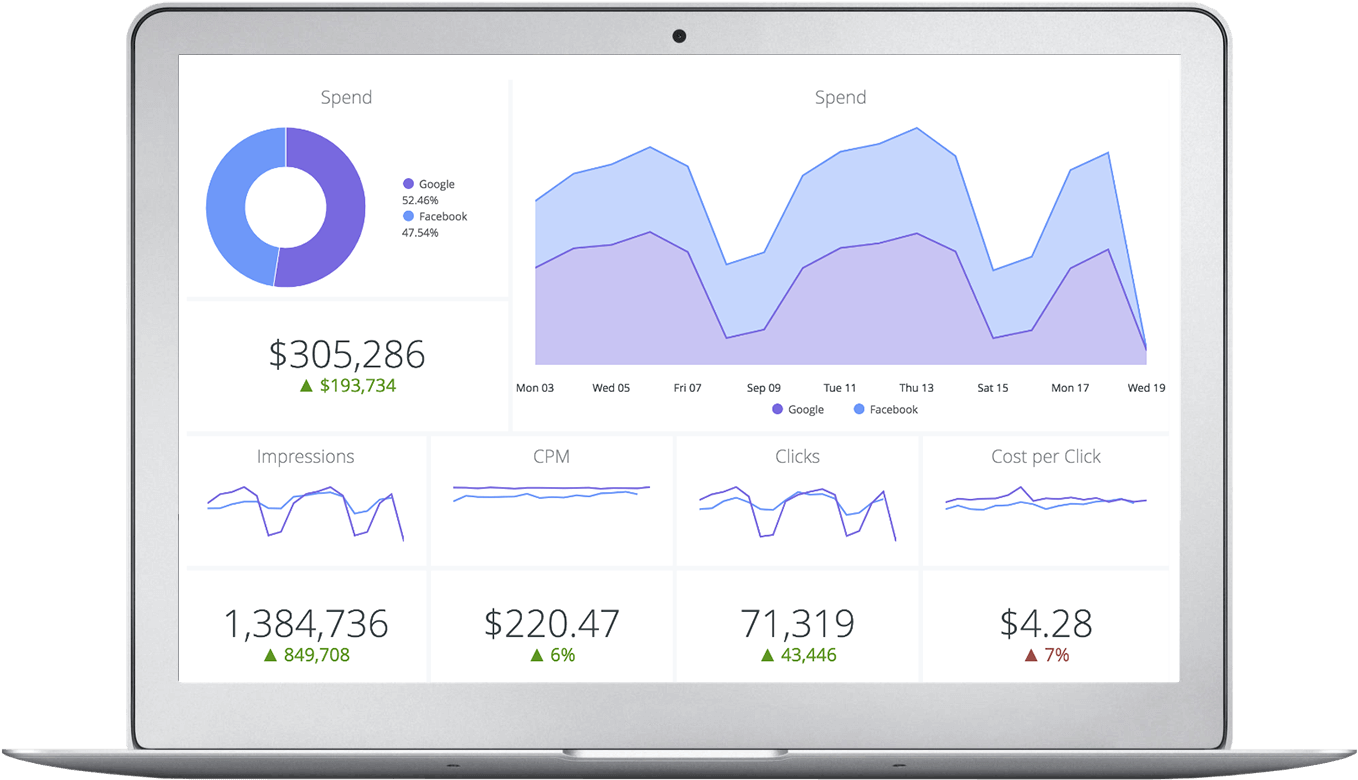
A data analytics suite will collect, measure and analyze customer behavior. A tracking library will record data from your mobile app, servers or website. Everything will be tracked, including items that are added to a shopper’s cart and how many times a video has been viewed. Some of the most common stats to track are entry and exit points, behaviors, sessions, unique visitors, and visits. Analytics can also help companies figure out the different segments of their audience and their customer journeys and life cycles; analyze A/B testing; and perform automated messaging.
Once data is collected, a specialized team can figure out which components of your online presence are keeping the user engaged – and where they’re falling off. The overall goal is to do more of what’s working and to tweak the areas of the customer journey that aren’t delivering positive results. Your analytics suite should help you reach – and then surpass – your goals.
Questions to Ask About Your Business
You can’t possibly pick the right set of analytics tools for your online business if you don’t have a handle on things like how much data you have, which metrics you want to track and what your business goals are. In this section, we’re going to ask you those questions so you can start thinking about them as you pick and choose the features that are most important to you.
How Much Data are You Going to Track?
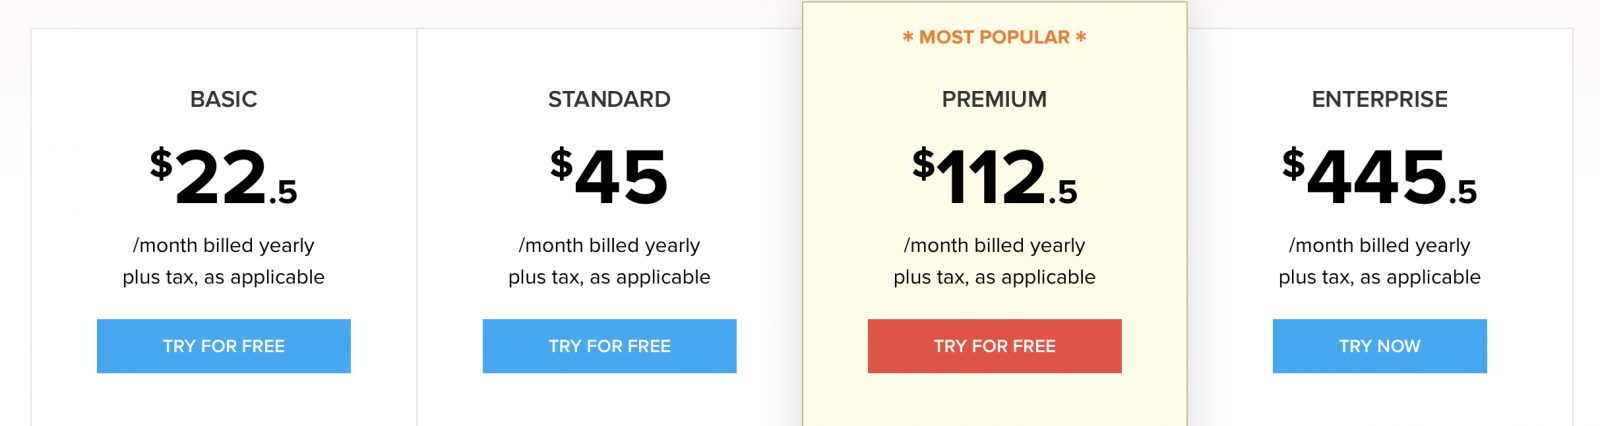
The first thing to determine is how much data you’ll be tracking. This will help you decide the vendor and/or the plan you should go with. Some vendors are geared specifically toward small, mid-size or enterprise-level businesses, while others will have tiered plans to cater to all different data volumes.
If you don’t yet have a lot of data to track, like if you’re just launched a brand new business and are in the very first stages of growing an audience, you won’t need to track a lot of users, sessions or actions every month, which means you can keep costs down. On the other hand, big and enterprise-level businesses have a ton of data to track and they’ll want to see stats in real-time in order to make important decisions on-the-fly, so those businesses will want to spend more on their analytics tools.
What Type of Data do You Want to Track?
In addition to volume of data, you’ll have to decide the types of data to track. Put more simply, you’ll have to consider the questions you need answered.
If you work for a small company or a startup, you probably care mostly about engagement and retention data, and you don’t want to be flooded with metrics you don’t understand and can’t use right now.
On the flip side, if your company is large, mature or both, you’ll likely have specialists or entire teams dedicated to wading through those metrics. You can then ask complex questions like, “If a customer discovers our content using this specific keyword, which content is best at converting them into a customer?”
A Few More Questions to Consider
- Do you want to be able to run analytics retroactively, meaning gather metrics even if you didn’t have data collection set up before?
- Who will be accessing and deciphering the reports? Do you have specialists on your team or do you need data and reports that can be used by non-technical employees?
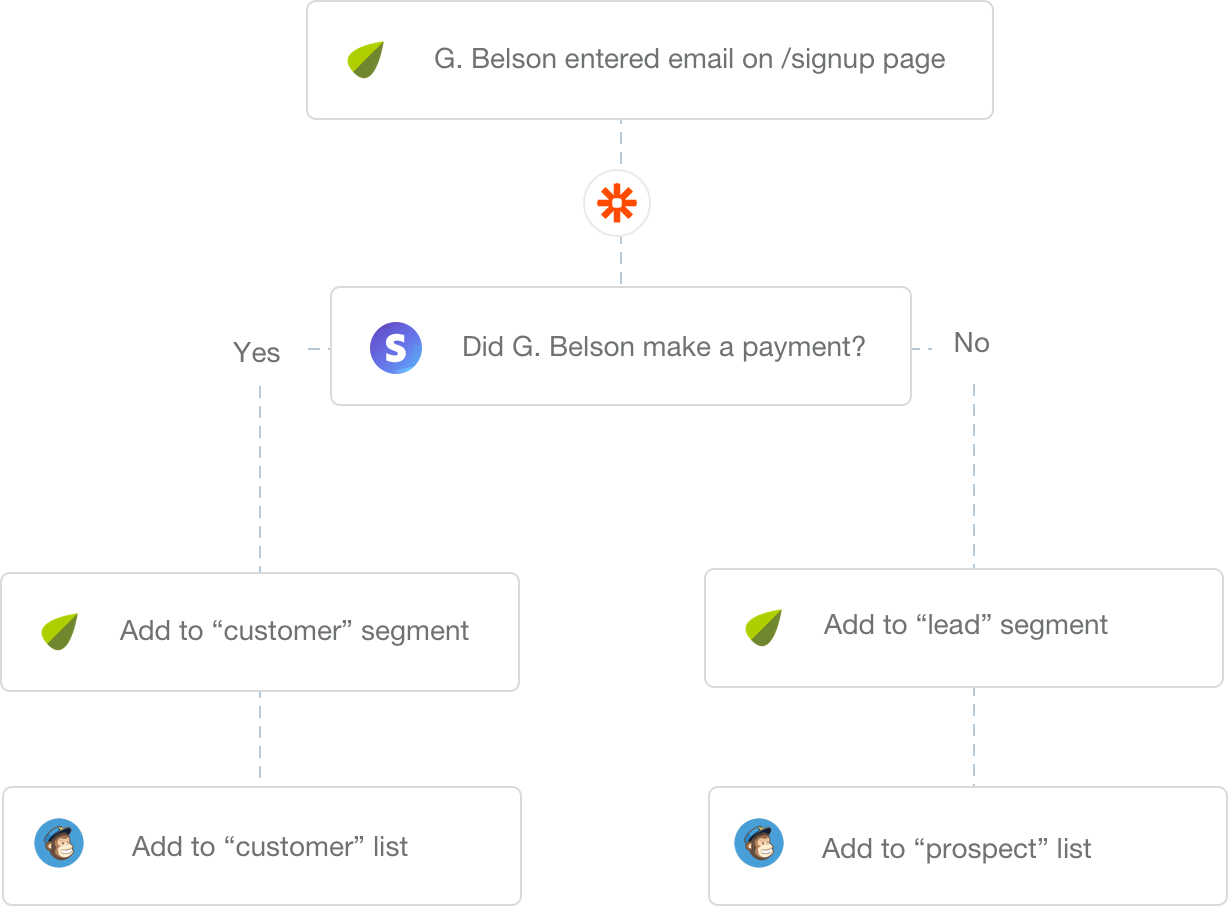
- Do you need automation features? For example, some data analytics suites come with email automation triggered by specific behaviors.
Features to Look For
As we said before, this section isn’t intended to be an exhaustive list of all the features you’ll have in your analytics suite. However, it does talk about some of the biggest considerations most online businesses will make. The purpose of an analytics suite is to give you an actionable and rich 360-degree view of your online business’ data. We discuss everything from user-friendliness to the specific metrics you may want to track.
This section is organized alphabetically so you can easily find the feature you’re most interested in. The order of the features don’t refer to their importance or hierarchy.
A/B Testing
A/B testing lets you create and run experiments in order to see which version of a landing page (or web page or any other type of content) performs better.
There are a few ways to collect data from A/B testing. If you go with a hosted solution like Unbounce, the provider will host the landing pages. You can’t necessarily run the test on a page that’s hosted on your website, but you can get stats specifically for the test. If you have a tech-savvy member of your team, you can use a JavaScript-based tool like Kissmetrics. This will require you to add the code to the pages on your website.
A lot of the time, these tools are going to be lacking in one area or another. For example, you may not be able to run a test on just part of your traffic, like visitors who come from a specific channel or a segment of your audience. You may also not be able to access a detailed report for each of your funnels. If not having one of these qualities is going to be an issue, make sure to research A/B testing functionality before settling on a tool.
Visual Website Optimizer is an excellent tool that checks a lot of boxes. It lets you create experiments without having a technical background and it will cover all of your tests.
Behavioral Targeting
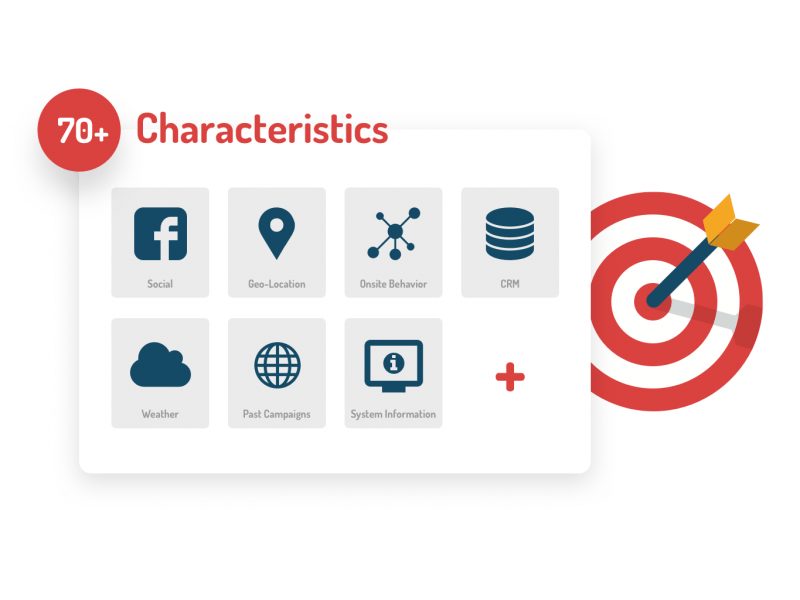
With behavioral targeting analytics you can figure out where visitors came from and what actions they took on your website in order to personalize their experience moving forward. For a powerful behavioral targeting tool, consider Personyze.
Dashboard
The dashboard of your analytics suite should be customizable. That way, you can see just the information and metrics you want without unnecessary information clogging it up.
Data Export and Reporting
You should be able to export the data you collect to third-party tools in order to analyze the information more. There are lots of programs that will let you export data. Excellent Analytics and Google Analytics are good options.
If you want the tool to generate reports (which most of them do), the best reports will be free of hard-to-understand jargon. They’ll be easy to read and to make sense of, and they’ll be oriented to your business.
Something to be wary of when it comes to reports, though. You don’t want to create reports for the sake of creating reports (or, worse, pay an employee to do this as their main job). You have to think about why certain reports are needed, which questions they’re answering and what the next step is once the report’s been generated. Otherwise, you just have a lot of pretty reports that don’t mean very much.
External Events
There are going to be times when data from outside your main website is needed, like if your customers are on a different website or tool. You’ll need a way to get this information into your data analytics suite.
Funnel Analysis
A sales funnel is the process that your customer will go through to convert. It can be simple or complex, but a basic sales funnel has something like a landing page to intrigue the customer, a freebie offer or a discount to get them to give you their email address, and then a product or service that they purchase from you.
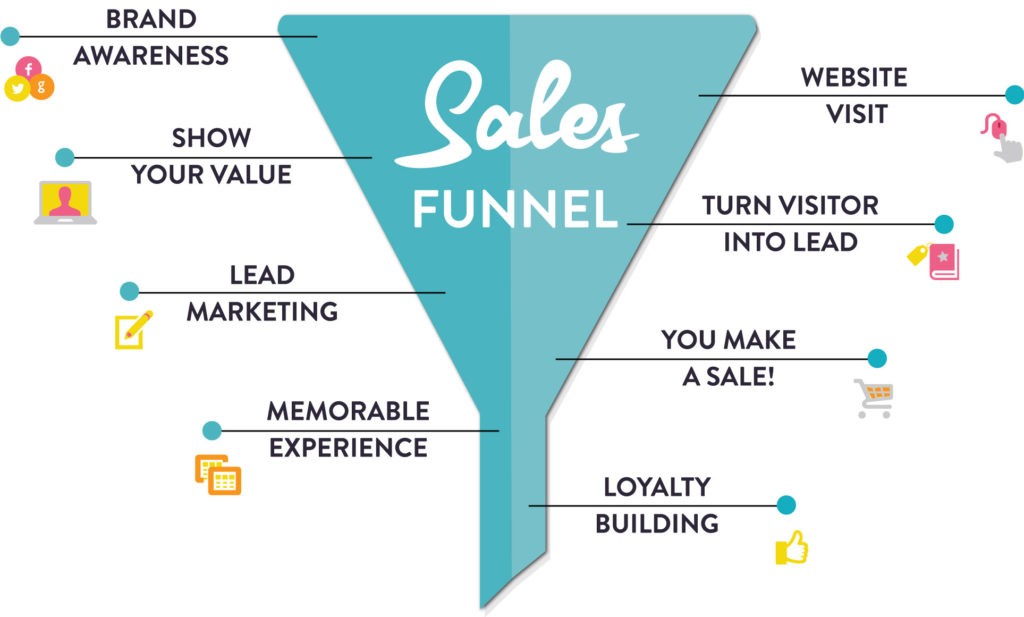
Funnel analysis will help you define funnels and give you reports about conversion rates for each step of the funnel. Clicktale lets you auto-build funnels based on common steps or you can define your own funnels.
Funnel analysis tools can be costly. One way around that is to only have the second step of the funnel recorded. For example, let’s say you have a basic funnel with the first step being a landing page, the second step having a “click to register” option and then the third step being registration. Instead of tracking when people go to the landing page, you can only track when someone clicks the “click to register” link. You can then use Google Analytics to track conversion rate on the landing page. Overall, this could lower your costs.
Heat and Scroll Maps
A heat map can be thought of as the fingerprints a visitor leaves on your website. It’ll show you what the customer clicked on. A scroll map is pretty much the same thing but for scrolling instead of clicking. Maps can help you determine which parts of your web page visitors are drawn to and which ones they’re ignoring or veering away from. Crazy Egg and Clicktale are both good options for tracking your maps. Crazy Egg in particular is intuitive and user-friendly.
If you have something other than classic buttons and links, like Flash or Silverlight, a tool like Google Analytics isn’t going to be able to capture the data. You’ll need to look for a tool that you can use with the type of buttons and links you have. Also, if you have the same link on a page more than once, many tools aren’t going to be able to tell the difference between the matching links and you’ll get the same data for all instances of the link.
Real User Monitoring
While some people don’t consider these metrics to be of the utmost importance, we still feel that they’re worth mentioning, and you may find that you very much care about this data. Real User Monitoring refers to things like abandonment rate and page load time, and these metrics play a major role in analyzing your website and optimizing it for better performance. The most accurate tools for tracking and reporting this data will be JavaScript-based, which means you’ll need a specialist on hand.
Traditional Web Analytics Reports
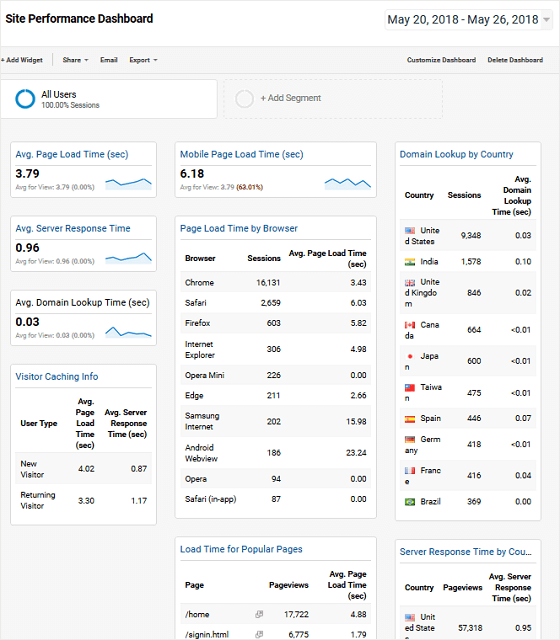
There are a few basic analytics reports you’ll probably want access to. General usage reports tell you things like bounce rates, visits and visitors, page views, and your highest-performing content. Visitor attribution gives you insight into your audience’s demographics and may include browser, operating system, screen resolution and country. Traffic source analysis tells you which marketing channels your visitors are coming from. Within those channels, you can see more advanced analytics to determine which banner placements or keywords are having the biggest impact. Google Analytics is one of the best tools for generating traditional web analytics reports, specifically about usage and traffic.
Visitor Usage Reports
These reports will let you go in-depth with data from each user as well as information about overall usage. Tend lets you see the different interactions customers have with your website, specifically those that led them to convert to a customer. There’s also an advanced search to let you drill down into their behavior even more.
Voice of Customer Tools
Voice of Customer data lets you collect invaluable feedback from your audience through the use of surveys. In your data analytics suite, you’ll be able to see who sees the surveys and where and when they see them.
5 Mistakes to Avoid When Choosing Your Analytics Tools
The perks of having a reliable, thorough analytics suite set up are evident. However, far too many businesses try to start tracking and analyzing data before they’re ready, which wastes your budget and leaves you with a bunch of information you have no idea what to do with. Avoid the following six mistakes to truly get the best ROI from your analytics suite.
Mistake #1: Thinking your analytics suite is a replacement for your sales process.
The data analytics tools you use are just that: tools. They’re not a strategy, they’re a way to assess the strategies you already have in place. No matter how robust a system you’ve employed, your analytics software can’t create a compelling and effective sales strategy for you. Even if you end up changing everything about it, you really should have a sales strategy in place before setting up analytics. What sales funnels are you going to track if you don’t have sales funnels at all?
Mistake #2: Trying to find importance in each and every metric possible.
There’s no end to the data sets you can track. You can track customer behavior, internal performance and even worldwide industry trends. It’s exciting to think of having all of this information at your fingertips…until you’re drowning in it. You won’t be able to get anything meaningful out of all the insights you can gather. Whittle your list down to the metrics that matter most to your business right now and keep a few in mind that you plan to add later.
Mistake #3: Focusing on the little metrics instead of the big ones.
With a great analytics suite, you can find out so much about your customers and their behaviors. You can find data that will help you target them on a totally custom, personalized level. The only problem is that if you’re not actually converting customers in the first place, why are you bothering finding out everything you can about the few customers you do have?
This is just one example of a common problem. Before you can dig into the intricacies of your audience and user engagement you have to make sure that you’re reaching your big priority goals first, i.e. converting users because your targeting and message are on point. If that’s an issue, fix it before you focus on the more minute details.
Mistake #4: Tracking everything but acting on nothing.
This is a common mistake businesses make particularly if they went for years without tracking their data. There’s a tendency for some business owners to go with their gut. If you’re not hitting your goals, though, then your gut is misleading you. Collecting the data is just part of the process – you have to analyze it and take action, too. And you have to do this frequently because customers are constantly changing their demands and preferences.
Mistake #5: Ignoring or missing tracking errors.
Tracking errors can result in faulty, misleading or unreliable analysis of your data. They’re also super common, especially if you’re trying to handle everything in-house but don’t have a specialist on your team. You need to be able to (a) set up tracking correctly from the beginning and (b) detect tracking problems immediately. If your developer can’t do either of these things, you’re in trouble. For the most part, marketing teams don’t know the ins and outs of the technical part of data tracking. Make sure you have a reliable, tech-savvy person on your team or consider using a third-party company who will handle all of this for you.
Final Thoughts on Finding the Best Analytics Software
Finding the right data analytics suite for your business is a big task. There are so many options out there, all with their own selection of features and level of sophistication. It’s important to understand that it’s unlikely you’ll find a 100% comprehensive solution – and if you do, it’s going to cost a ton. This is why it’s so important to have a firm handle on what you absolutely need and what you can live without for now. Also, it’s fine to have a list of features that you’d like but that aren’t a necessity at this point. Remember, there’s a difference between comprehensive for all and comprehensive for you.
In order to create a short list of the best options, think about the size of your company and your data volume, as well as your budget. From there, write a list of the most important questions you need answered. Don’t forget to consult the teams who will be most impacted by customer analytics (like your support agents, for example). Already have analytics set up? Where are they lacking and what gaps do you need to fill?
If you expect to have a lot of areas of improvement and you don’t have a big budget yet to pay for complex data analytics, it may be worth it to purchase a monthly plan for just a month or two, collect a bunch of data and then cancel the subscription while you make all of the changes you need.
Here are some other related articles you may be interested in:
Analytics Dashboards
- Mixpanel Vs Google Analytics: Which is Better?
- Mixpanel vs Amplitude Compared
- ClickMagick vs Voluum: Which is the Best Ad Tracking Software?
- Clickmagick Review: Is it the Best?
- ClickMeter Review: Find Out All You Need to Know
- Voluum Review