- Bottom Line Up Front
- The Elements of a Gantt Chart
- Gantt Chart Benefits for Project Management
- Gantt Chart Pros and Cons
- 5 Gantt Chart Tools You May Want to Use
- 3 Pro Tips for Getting Started With a Gantt Chart
- How Not To Use a Gantt Chart
- 4+ Tools to Consider When a Gantt Chart Isn’t the Best Choice
- FAQs
- Final Thoughts About Gantt Charts for Project Management
Last Updated on April 22, 2023 by Ewen Finser
There are many ways to set up and manage a project. No matter what, though, quality project management means organizing the tasks that need to be accomplished, defining what needs to be done and when (including which tasks depend on one another), and making sure that everything stays on schedule throughout the course of the project.
A Gantt chart is one of the most popular ways that companies manage projects, graphically depicting the project’s schedule as a horizontal bar chart.
There are the start and end dates for different elements, and bars running horizontally show when certain aspects of the project will take place and the progress that’s been made on them. The Gantt chart is named after its creator, Henry Gantt, a mechanical engineer.
Bottom Line Up Front
A Gantt chart is a tool used by project managers and companies to keep track of the different tasks needed to complete a project, how long those tasks will take, who will be working on them, and which tasks are dependent on one another.
A Y axis and X axis organize the task’s names and time frames, and bars within the chart show how long each task will take and when it will be worked on.
The Elements of a Gantt Chart
Gantt charts can be simple or detailed, and they can also start out simple and get more detailed as the project is fleshed out. There are three main elements of a Gantt chart, no matter how minimalistic or in-depth it is:
- The tasks that need to be completed. These run along the Y axis, meaning the left-side column of the chart.
- The progress stages, which is broken into periods of time, such as the months of a year. These run along the X axis, which is the top row of the chart.
- Horizontal progress bars with start and end dates.
Let’s talk about these elements some more:
Y-Axis Column
There’s a column on the left-hand side of the chart that lists the tasks from top to bottom, in the same sequence that they need to be completed. For example, the left-hand column may have a vertical list of tasks like:
- Brainstorm
- Plan
- Research
- Design
- Implement
- Follow-Up
Of course, you can replace the above list and expand it with whatever makes sense for your project. But this example will give you an idea of the types of tasks included in a Gantt chart and how they’re arranged in order of what needs to be completed first to last.
X-Axis Row
Along the top row, from left to right, is the timetable. Often, it will be broken down into months. For example, the top row may have the following from left to right:
- January 2023
- February 2023
- March 2023
- April 2023
- And so on…
Don’t feel like you have to use months, though. You can use whatever timetable makes sense for your project, whether that’s broken down smaller than months or it’s on a longer timeline.
Horizontal Progress Bars
In the main part of the chart, there will be horizontal bars of different lengths, and sometimes they’ll be color-coded. These bars represent the overall timeline of the project, and each one is designated for a specific task and its sequence within the project, its duration, and its start/end dates. The bar can also illustrate how much of the task has been completed versus how much is left to do.
Gantt Chart Benefits for Project Management
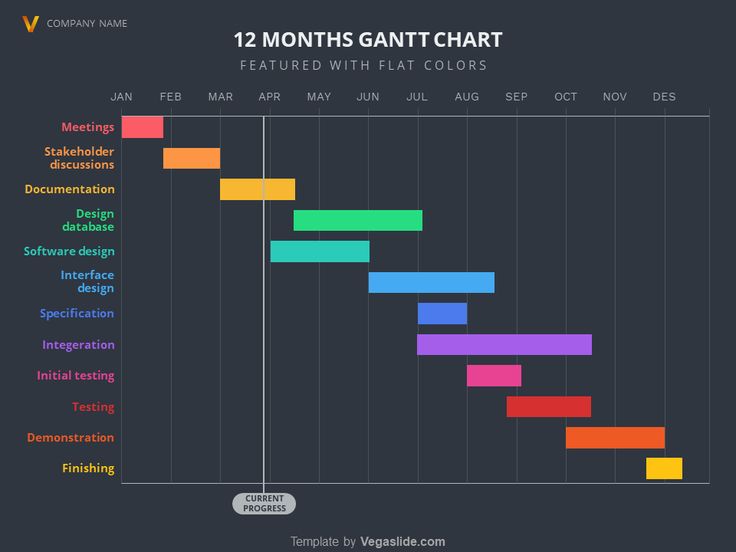
Gantt charts let project managers and team members visualize the schedule of a project, including all of the different tasks and sub-projects that have to be completed along the way. The chart allows for scheduling, managing, and monitoring those tasks, as well as the resources a project will require. Here are a few more benefits of using a Gantt chart:
Versatile Adaptability
Gantt charts can be used for all sorts of projects. They’re as useful when building a highway or constructing a bridge as they are when rolling out a new product for an e-commerce shop or developing computer software.
Easy Visualization
A Gantt chart provides a way to see what has been completed, what’s coming up next, and everything that’s left to do for a project. This makes it easy for project managers to explain a project’s plans or status to clients, other teams, stakeholders, etc.
Preliminary Troubleshooting
Since Gantt charts lay out each task in an organized and clear-cut manner, it’s easy to quickly see which tasks rely on others, as well as which tasks can be completed at the same time as others.
For example, you can’t move to the Research phase of a project before you’re finished with the Brainstorm phase, so those tasks are dependent on one another. But when certain Design tasks are completed, some team members can move on to Implementation while other Design tasks are still being handled, so some of those tasks can be worked on in tandem.
A Gantt chart lets you see all of this quickly. Plus, the more detailed the tasks are, the more methodically the team can approach the project.
Those bars also let project managers spot potential bottlenecks. Is the team going to be spread too thin because too much has to be tackled at once? In that case, the project manager may opt to get rid of non-critical tasks or move them to another spot on the schedule.
Gantt Chart Pros and Cons
While we love a good Gantt chart, it’s not without its flaws. In this section, let’s briefly go over the major pros and cons of Gantt charts:
Gantt Chart Pros
- A Gantt chart provides a large-scale overview of a project in an attractive, streamlined and visual way.
- All team members will know exactly what their role is and which tasks they’re responsible for, as well as who is handling other parts of the project.
- Workflow and task progress, as well as project progress as a whole, are very easy to track when you’re using a Gantt chart.
- Gantt charts clearly show how certain tasks are dependent upon one another or may overlap one another – and which tasks are totally independent.
- Gantt charts don’t have to be 100% finalized. They have a certain amount of flexibility that will allow you to make changes, additions and deletions as needed.
Gantt Chart Cons
- You need to have the project specifics and timeline figured out before you can create the timeline.
- It can take a long time to set up a Gantt chart, especially for more involved projects.
- Gantt charts don’t always have a way of showing the importance of a task, only when it needs to be done, how long it should take and how it relates to other tasks.
- For very large projects with a lot of sub-tasks, the Gantt chart can be so overwhelmed with information that it ceases to be easy to understand, which can defeat the purpose of using one in the first place.
- It’s not possible to manage all of the resources required for a project with a Gantt chart, so you’ll need to use an additional tool for this.
5 Gantt Chart Tools You May Want to Use
A Gantt chart is relatively easy to create on your own with a simple spreadsheet on your computer. However, you may want something more powerful to help you organize an upcoming project as best as possible. In that case, consider Gantt chart software – there’s a ton to choose from!
There are a few benefits specific to specialized Gantt chart software that you wouldn’t get from a regular ol’ spreadsheet:
- Breaking down main tasks into actionable steps so that everyone’s on the same page about what needs to be done.
- Monitoring how much time it actually takes to finish tasks (instead of relying on employee reporting of time spent).
- Preventing tasks from being started when other dependent tasks are not yet completed.
- Verifying the team members who are assigned to different tasks – there may not be enough room in a traditional Gantt chart for this.
Note that the best way to use Gantt chart software is to already have a pretty good idea of your project plan, its tasks, and the different due dates. That will make it a lot easier to input the info into the software – though, of course, you can always make changes once you have a better view of your project.
Now, let’s go over some of the best digital products for Gantt chart creation and management.
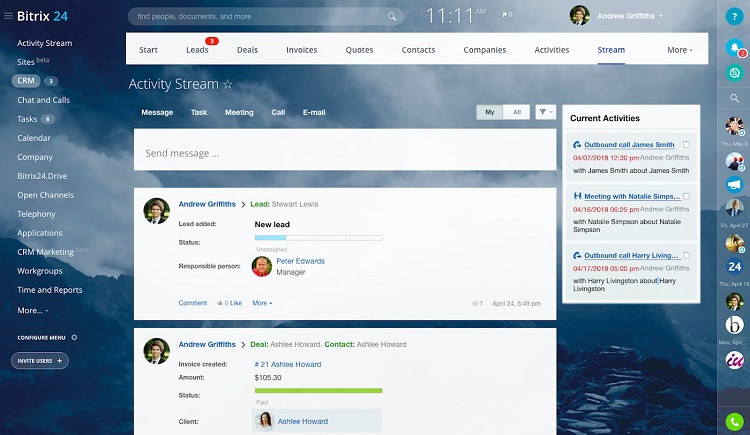
Bitrix24
If you’re often on the go, you need a Gantt chart system that lets you access your project wherever you are, as well as stay in touch with your team as much as possible.
Now, you may think that you’ll only work when you’re stationed in front of your computer, but take it from a freelancer – there are going to be many times when it’s most convenient to have work right at your fingertips. Sometimes this level of accessibility is the best way to strike a work-life balance because you won’t be distracted by wondering what you’re missing or trying to remember to-dos – you can just get it done and move on.
Also, Bitrix24 lets you create as many charts as you need, so you won’t have to switch between multiple tools to keep an eye on all the projects you’re juggling. And, as touched on above, it has Android and iOS apps so that you can manage your projects from your mobile device. There are also lots of ways to communicate with your team, including chat and video calling.
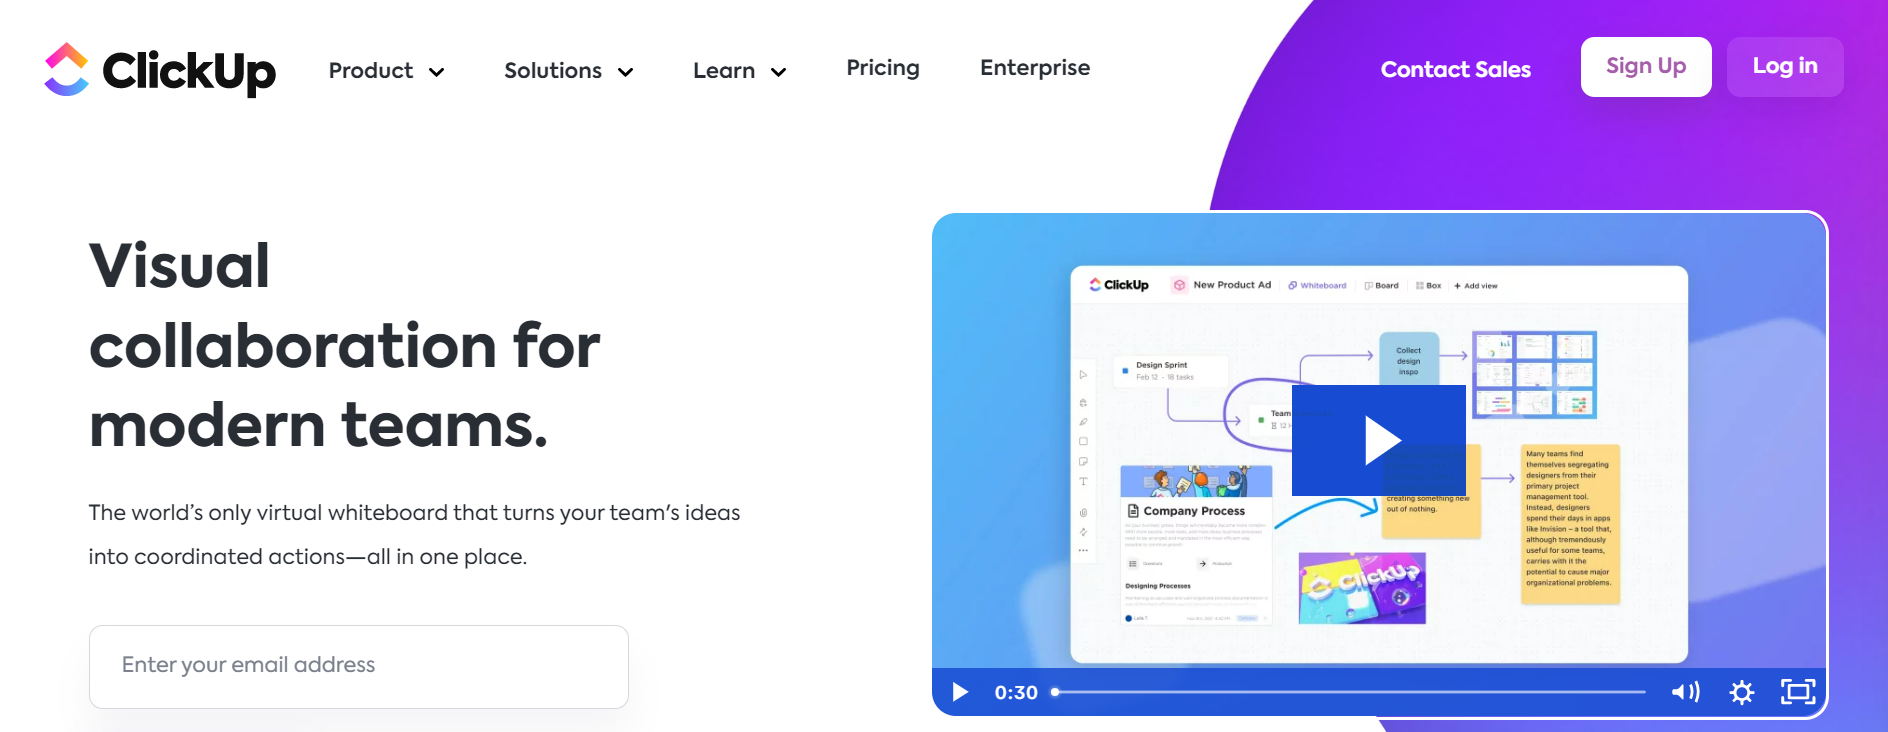
ClickUp
While many project managers and companies may use ClickUp for its kanban-style approach, the service also has Gantt chart capabilities.
What’s especially great about ClickUp is that you can view one project in several ways, including Gantt, as well as calendar, timeline, and more. There are also a lot of top-tier features you’ll get with ClickUp, like assigning tasks to multiple team members, creating to-do lists for tasks, and seeing the progress percentage of a task.
In my experience, ClickUp has a steep learning curve, and it can be a little finicky (what digital tool can’t be, though?). But since it also has so many bells and whistles, figuring it out is probably going to be worth your time. On top of creating Gantt charts, you may be able to do everything within ClickUp, from communicating with your team members to managing resources.
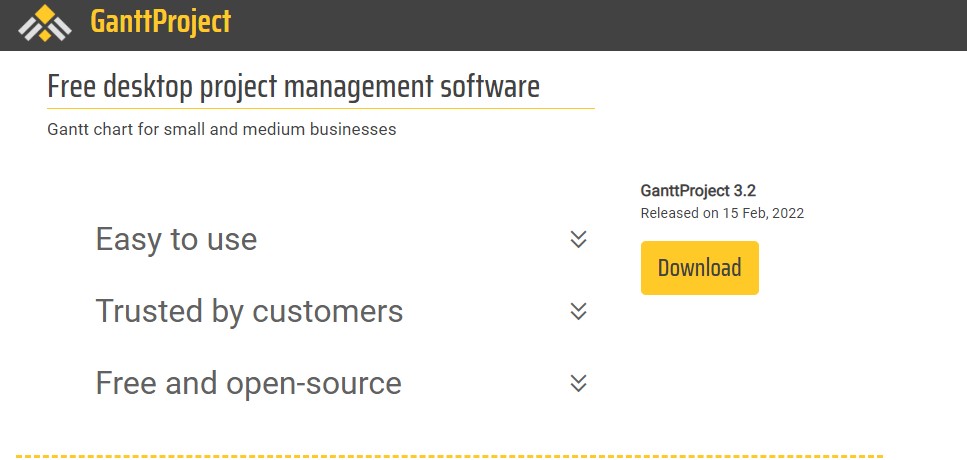
GanttProject
Sometimes, you want to lay out an upcoming project without learning how to use a bunch of features. If what you want is a simple Gantt chart maker, consider GanttProject.
Its basic tools let you do everything you need to build a Gantt chart, like draw lines between tasks to illustrate dependencies and color-code tasks for more organized grouping. Personally, I think GanttProject is an excellent way to draft a Gantt chart and see how it’s all going to fit together. You can always recreate it with more in-depth software later on when you’ve hammered out the details.
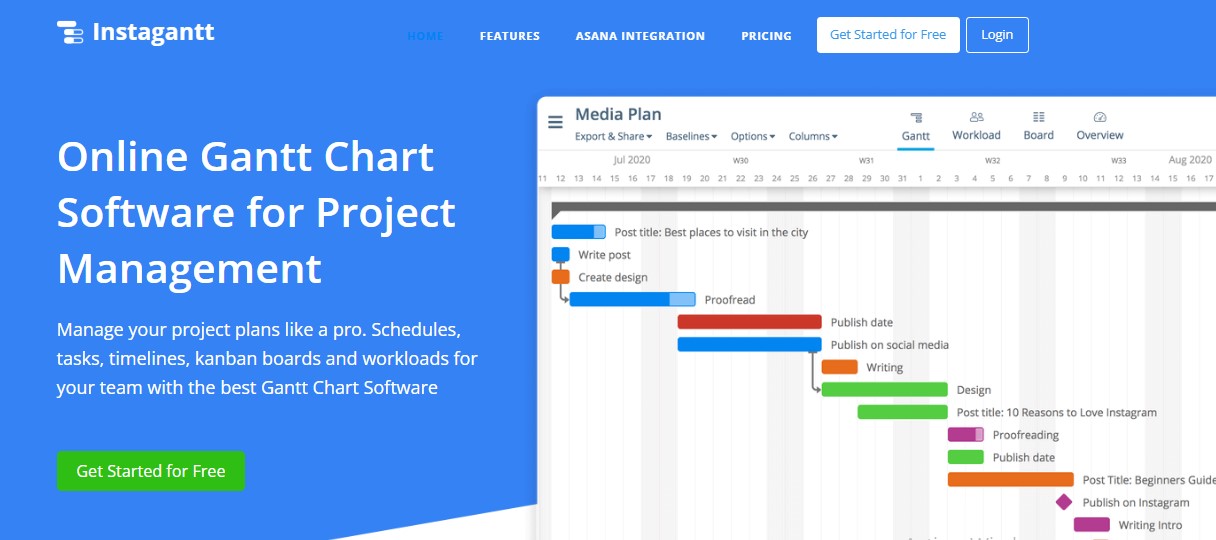
Instagantt
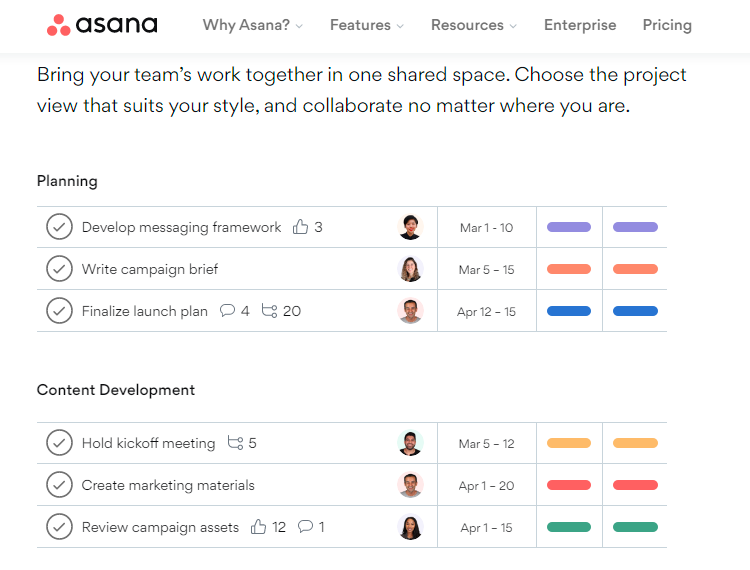
If you’re an Asana user and want to integrate a Gantt chart into your project management workflow, check out Instagantt.
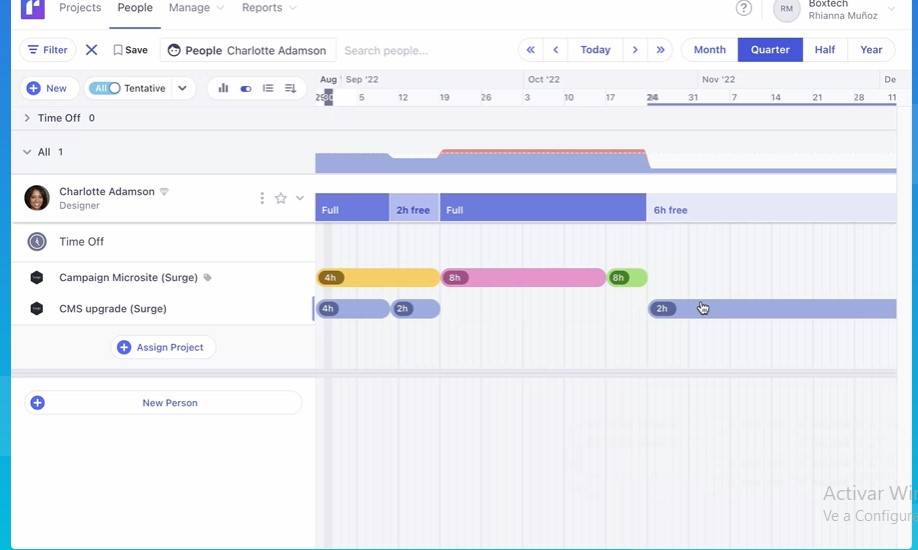
One of the main features of Instagantt is workload management, allowing you to quickly see which teams or employees are overloaded so you can reallocate their work. And helpfully, milestones let you see what’s been accomplished and which part of the project still needs work done.
Asana is a close alternative to ClickUp, and the one you prefer will be based more on personal preference than the tools available (and maybe pricing will be a factor, too, as Asana’s costs can get steep). Personally, I’ve always found Asana more pleasing to use, but it does tend to go down a lot – which may be a big problem if you and your team are using it practically around the clock. To balance out that drawback, though, I find it easier to learn and use than ClickUp.
Either way, you probably won’t want to juggle too many tools. My suggestion is to pick one main one, and then if you need to use any other tools, make sure they integrate. So, Instagantt would be a great integration with Asana, but if you’re going to go with ClickUp, then stick just with that tool (and maybe others that seamlessly integrate). That way, you’ll have everything you need pretty much in one place.
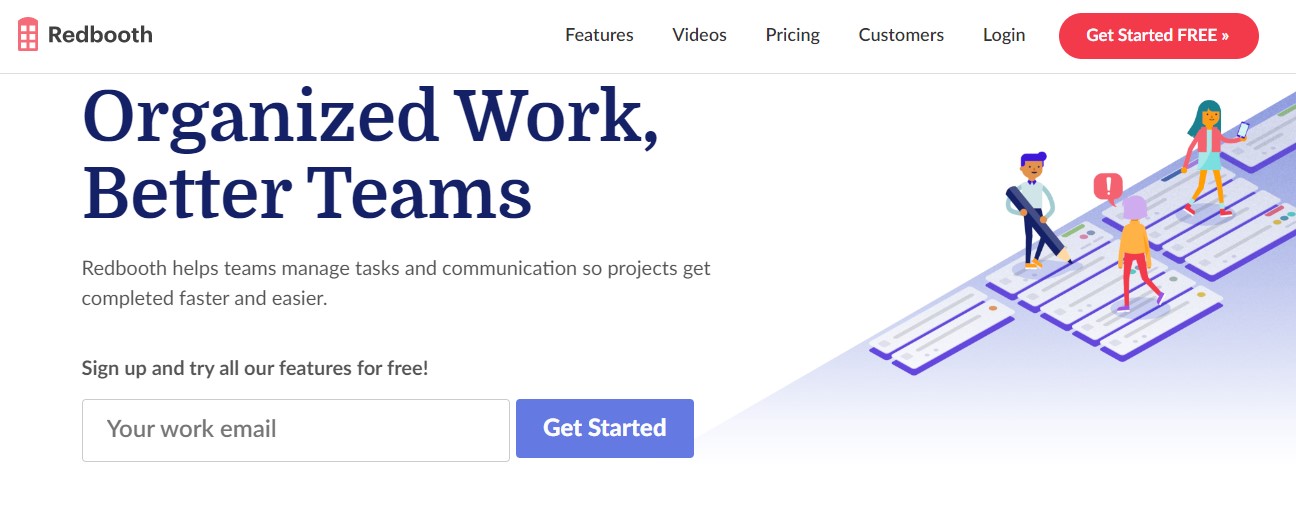
Redbooth
Like ClickUp, Redbooth is much more than a simple Gantt chart creator – it’s also a full-scale project management system. And with the Chrome extension, you can keep track of a project right from the browser.
Plus, you can create project templates, which means you won’t have to create a project from scratch if it’s similar to something you worked on in the past. While I’m not a Chrome user myself, those who are go crazy for browser integrations – there’s nothing easier than having everything you need a mouse swipe and click away.
3 Pro Tips for Getting Started With a Gantt Chart
If you think using a Gantt chart will help keep your upcoming project on track, make sure to heed the following advice. Here’s how to make a Gantt chart work for you and your team – getting started on the right foot will ensure success once you actually start building your chart:
1. Identify your project
First things first: Is a Gantt chart the right match for your project? If you’re trying to document a project, it will probably work well for you. But if you’re trying to keep track of or organize a process, you may have better luck with a flowchart. Here are the basic differences between a project and a process to help you decide:
Project: A project is a single endeavor that requires multiple steps to complete. It has a start date and an end date, plus time-bound steps in between to move the project forward.
Process: A process is a collection of steps that have to be done in a certain order and can be repeated. A process may be part of a project, but it’s a way of doing something, not a result of those steps.
2. Split up the project into manageable bites
Before you can figure out what needs to get done and when, you have to split the project up so it’s more manageable. Figure out the project’s major components, then break those down into tasks, and then break the tasks down into sub-tasks.
3. Set the project’s timeline
Before you start setting up your Gantt chart, have an idea of the big dates associated with your project, namely the start and end dates. It will also be easier to input the information if you know the start date, due date, and duration for all of the project’s tasks.
If you’re using Gantt chart software, a lot of the scheduling work will be handled for you, especially when it comes to accounting for weekends and holidays. But if your Gantt chart tool isn’t so intuitive, you’ll have to figure these dates out for yourself.
How Not To Use a Gantt Chart
Gantt charts aren’t the best solution for every type of project. Here’s when to avoid them, along with other Gantt chart faux pas to avoid.
The Gantt chart shouldn’t be your first project planning tool
A Gantt chart can help you organize a project, but it’s not a good tool for creating your initial project plan. Gantt charts are too stringent when it comes to figuring out project intricacies, especially as you make decisions, add aspects of the project, get rid of others, etc.
Only move to Gantt chart creation once you have the following figured out:
- The major tasks that the project will require.
- How long each task is expected to take.
- The order in which those tasks need to be completed.
If you try to figure this out as you’re creating the Gantt chart, you could miss an integral step and then have to start from scratch. Give yourself time to think through the project fully before committing it to a Gantt chart.
Don’t try to manually create a Gantt chart
Yes, you could technically create a Gantt chart using just a spreadsheet, but this is going to be more trouble than it’s worth, especially if you have a semi-complex project to chart. The main problem here is that this approach doesn’t have enough flexibility – if you have to change, add or delete something, you’ll have to redo the whole chart (or at least a lot of it). When you use Gantt chart software, these adjustments will be much easier to make, often with the chart auto-updating for you to accommodate the changes.
Gantt charts aren’t useful for managing resources
There simply isn’t enough space in a Gantt chart to include every resource required to complete a task. And it’s not a good depiction of scope, either. The bars on a Gantt chart represent how long tasks will take to complete, but they don’t reflect the cost or scope of those tasks. A task that is only slotted for two weeks could require a ton of resources even though it fits into a short time frame, for example. That’s why you’ll need another tool for managing resources.
4+ Tools to Consider When a Gantt Chart Isn’t the Best Choice
Sometimes, a Gantt chart isn’t the best option for the project at hand or the phase of the project you’re currently in. Here are a few alternatives that may work better.
Mind Map
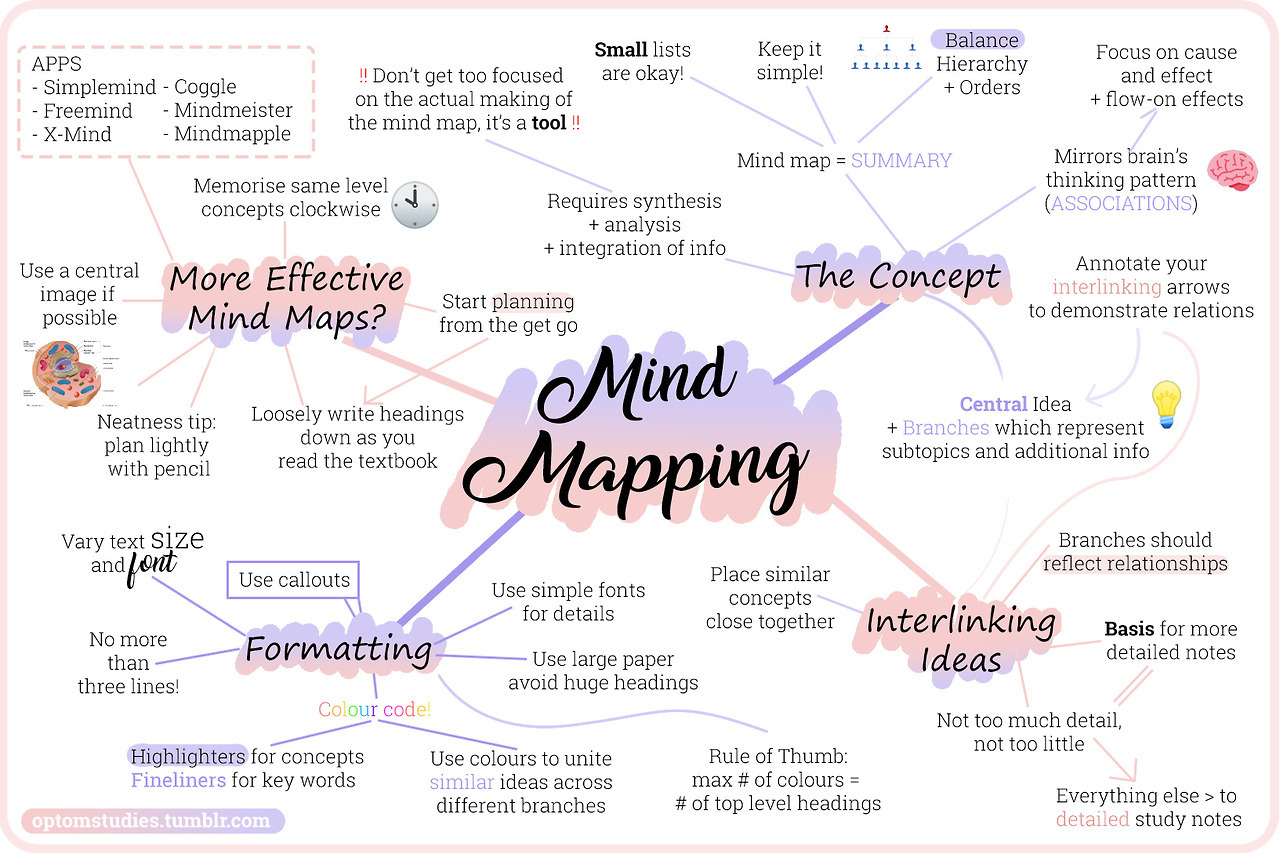
Not sure which elements your project will require? If you need a creative and ever-expanding way to get all of your project ideas out of your head and down onto paper, consider making a mind map. This is one of the most free-form ways to brainstorm, and since you’ll eventually be turning your ideas into a more streamlined project plan, it can be as sloppy as you need it to be.
Timeline
While a Gantt chart has aspects of a timeline, it’s more involved than a straightforward timeline. But sometimes, a simple timeline is exactly what’s needed, nothing more. If you’re presenting a project to another department or a client, for example, they may only want to know the biggest points of how it will progress, without concern for how long each and every task will take.
Kanban or Scrum Boards
If your team prefers a more flexible workflow with a way to physically represent their progress on a task, consider using a kanban or scrum board instead of a Gantt chart.
While there are digital tools that will let you set this up, like Asana, you can also create one yourself using a whiteboard and sticky notes. Basically, tasks are moved from one column to the next as they move toward completion – they may start off in “To Do,” then move to “In Progress” while they’re being worked on, then off to “Done” or “Needs Revisions.”
Resource Management Software
As we discussed, Gantt charts aren’t good solutions for resource management, so you’ll need an additional tool to keep track of all the resources a project requires. Software like Kantata, Runn, and ResourceGuru will have the tools you need, like budget monitoring, work capacity forecasting, and schedule management.
FAQs
Question: Why is a Gantt chart used?
Answer: Gantt charts are used by companies and project managers to see every task a project requires, when that task should be stopped and started, how much progress has been made on individual tasks and the project as a whole, and which tasks are dependent upon other ones. It gives both a bird’s-eye view and a more detailed breakdown of everything that goes into completing a project.
Question: What are three things included in a Gantt chart?
Answer: Every Gantt chart has three primary elements:
• Y axis with the tasks that need to be completed.
• X axis with the timetable (such as months or quarters of a year).
Horizontal bars in the main body of the chart that represent task progress.
While some Gantt charts may have more details, these are the three elements required to create any type of Gantt chart.
Question: Is a Gantt chart a timeline?
Answer: While a Gantt chart may look similar to a timeline, the two tools are actually quite different.
A timeline has events that are visualized along a single line. A Gantt chart is two-dimensional (as opposed to a one-dimensional timeline) and has a sequence of tasks, many of which are dependent on another or others in the chart.
A timeline can give a bird’s-eye view of the flow of a project, including start and end dates and events that take place in between. A Gantt chart shows the process for how that project is completed – what has to be completed first, last, and the steps between, with steps dependent on others. Instead of one timeline, there are different timelines based on the tasks that are on the Gantt chart.
Question: Who invented the Gantt chart?
Answer: Henry Gantt, an American mechanical engineer, management consultant, and social scientist, invented the Gantt chart. Through his work, Gantt developed methods meant to streamline workflows and increase productivity. In the 1910s, he made the Gantt chart so that supervisors could better understand how well (or poorly) their employees were performing and make sure that tasks were being completed on schedule.
Final Thoughts About Gantt Charts for Project Management
While a Gantt chart can have high-level detail, it’s essentially a basic and straightforward project management tool. It’s also easy to understand at a glance. That means that everyone involved with a project, whether it’s the team working on it or clients who only care about its progress, will be able to understand the status of the project at any given moment.
And even if an additional or alternative project management tool ends up being used – for example, if the team needs to have more communication than a Gantt chart allows – it’s still an excellent way to visualize every component of a project before it launches.


