Last Updated on May 31, 2023 by Ewen Finser
If you have a Webflow website, you might be wondering how you can better understand your visitors’ experience. Today, I’ll be looking at the best Webflow analytics tools, which will give you detailed information that could make a massive difference to your business.
Webflow is a great platform: it’s customizable, it has some powerful tools, and it’s pretty easy to use. However, signing up for an analytics tool can enhance your experience and allow you to make better decisions for your business based on actual data.
We’ll take a look at 10 of the best Webflow analytics tools. I’ll let you know what I like about them, and give you an overview of their key features, so you can figure out which one works best for you!
My Top Picks at a Glance
Of the 10 tools we’re looking at today, here are my favorites:
- Google Analytics – Google Analytics is a helpful tool used by many eCommerce business owners across the globe. It allows you to track metrics like SEO rankings and website traffic.
- Ahrefs – Ahrefs is a powerful platform with tons of great features. Ahrefs allows you to track your competitors, which is useful for crafting your marketing strategies.
- Hotjar – Hotjar is a useful little tool that provides you with real-time heatmaps to track your customer’s journey through your website. If you want to understand customer behavior, this is a good tool to go for.
- Amplitude – Amplitude is a powerful tool that gives you clear and in-depth visualizations of metrics like retention drivers.
- Optimizely – Optimizely is a split-testing tool that allows you to run experiments on your website to see which features perform the best.
Any of the above tools could make a big difference in terms of allowing you to understand visitor behavior on your Webflow site.
Top 10 Webflow Analytics Tools
Webflow data analytics tools vary in terms of what they can offer you. It’s worth thinking about the data you want to explore and then deciding which tool suits your needs. Some of these tools, like Google Analytics and Amplitude, give you insights into conversion rates and customer behavior. Others allow you to perform specific actions like split-testing (A/B testing) or measuring the performance of Facebook ads.
Each of these tools will give you more insight into how visitors interact with your Webflow site. The more data you have to work with, the better! Detailed information will allow you to make specific plans and targets for your business or website.
Some of these tools are pretty easy to integrate with Webflow: usually, it’s just a case of copying and pasting the code into your custom code section. Webflow has a series of tutorials on how to set up integrations with analytics tools, so you can follow those to get started.
Google Analytics
Google Analytics is a popular platform. It’s a great, simple way to measure basic metrics like SEO rankings and website traffic. You can get reports on where your website traffic is coming from, bounce rates, page views, and search queries, which is enough to give you some idea of where your customers are coming from and what they’re looking for.
I’d say there are some downsides to Google Analytics. First, it works by using a data sample rather than measuring your whole traffic. This means it will not be as accurate as some other tools. However, it’s easy to set up, and I like the onboarding process’s simplicity. It’s also easy to sync up with your Webflow account.
Google Analytics allows you to set up goals for your business. This means you can set a target – for example, a certain amount of clicks or sign-ups to a newsletter – and then Google Analytics will follow those metrics for you, so you can quickly see how you’re doing and possibly make changes to hit your goals on time.
Features
- Easy to set up
- Allows for reports on bounce rates, page views, and more
- Can set up conversion goals based on collected data
Amplitude
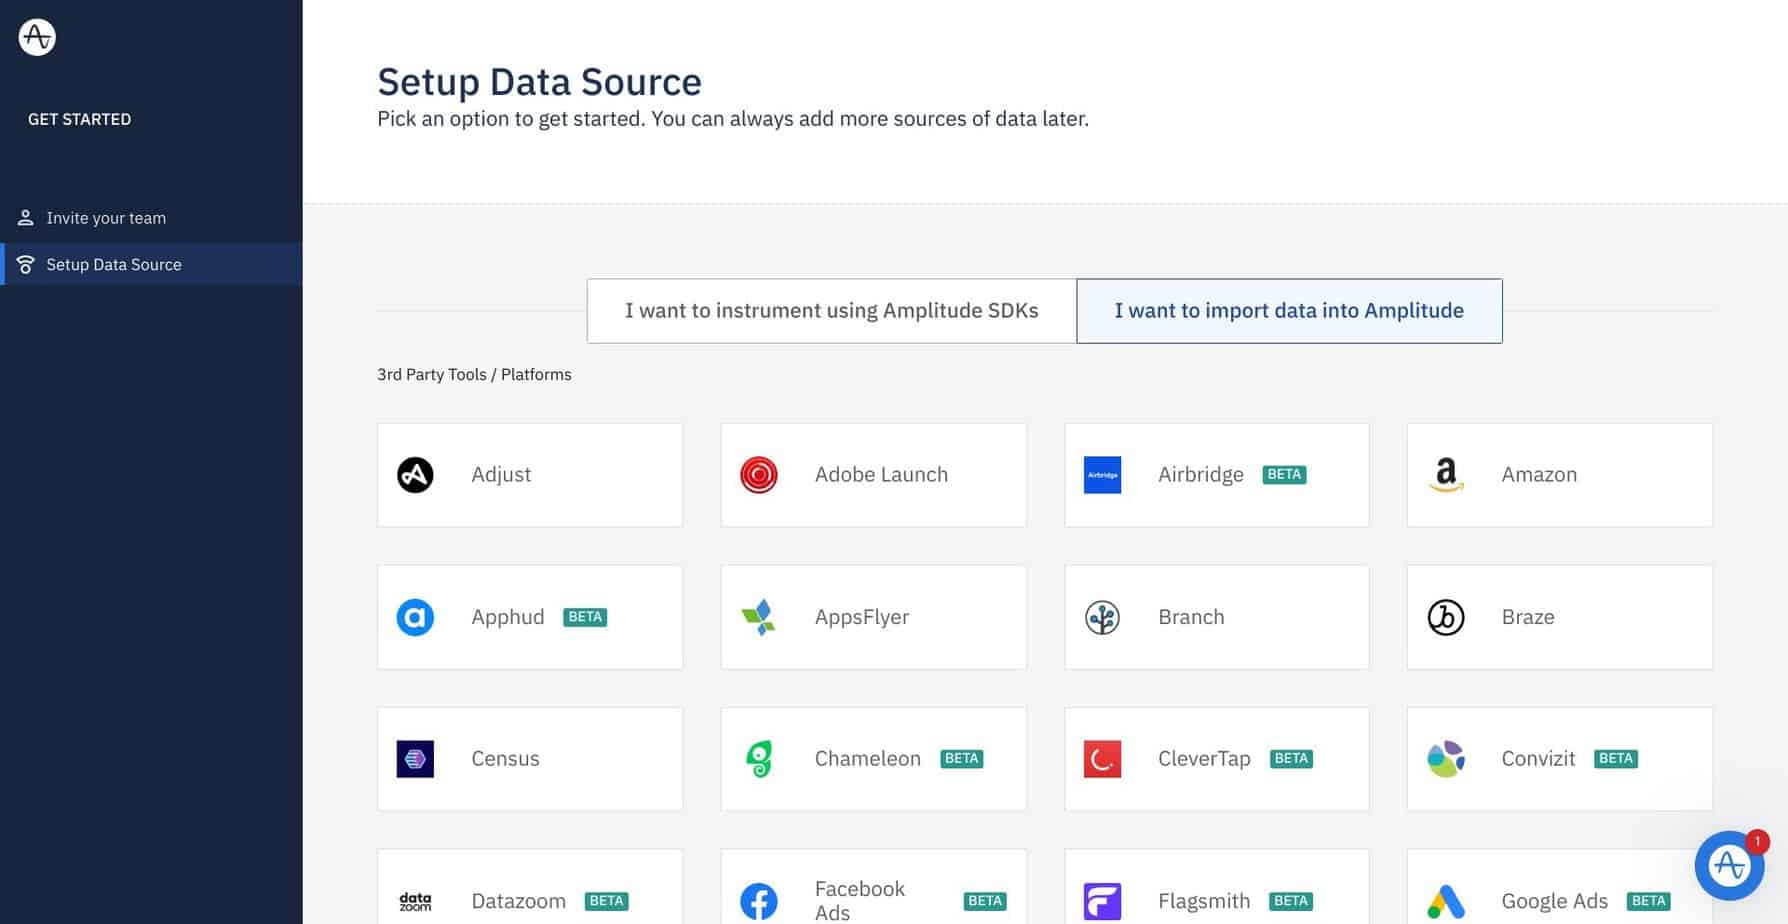
Amplitude is the tool to choose if you’re looking for in-depth analytics. Using data visualizations, you can gain some powerful information from Amplitude. It’s an excellent tool for collecting data about customer information: how they interact with your website, the journey they take, the features customers use the most, and retention drivers (the features that cause customers to leave or stay on your website).
They also use machine learning to forecast future behavior patterns. This potentially powerful tool allows you to prepare for the future by estimating trends. Amplitude has some decent features on its free plan, which is another reason I recommend checking it out: you can get a decent feel for how it works before you commit to a paid plan.
Features
- Detailed visualizations of customer behavior
- Email reports on various metrics
- Dashboard to show you the most crucial information at a glance
- Funnel Analysis shows a detailed breakdown of how customers interact with your website or product
Tableau
Tableau is another excellent tool for visual analytics. It allows you to create customizable reports, which are easy to download and share with others. The dashboard is excellent and can be adjusted to show the metrics that you want to see at a glance. In addition, it can use data from Google Analytics to track campaign performance, making it a good tool from a marketing perspective.
Tableau also has a powerful tool in the form of maps: it measures cities and postal codes to create useful maps, which is useful for both local businesses trying to establish an online presence, and eCommerce businesses hoping to go global. Finally, it’s also worth mentioning that it has excellent security credentials for data connections using authentication mechanisms.
While it does have some detailed tools, Tableau is intuitive to use, even for beginners, and they have some excellent guides to help you make the most of its services.
Features
- Excellent, customizable dashboards
- Easy to download and share detailed reports on different metrics
- Detailed map creation
- Great security
- It has a mobile app
- Great for measuring the effectiveness of marketing campaigns
Hotjar
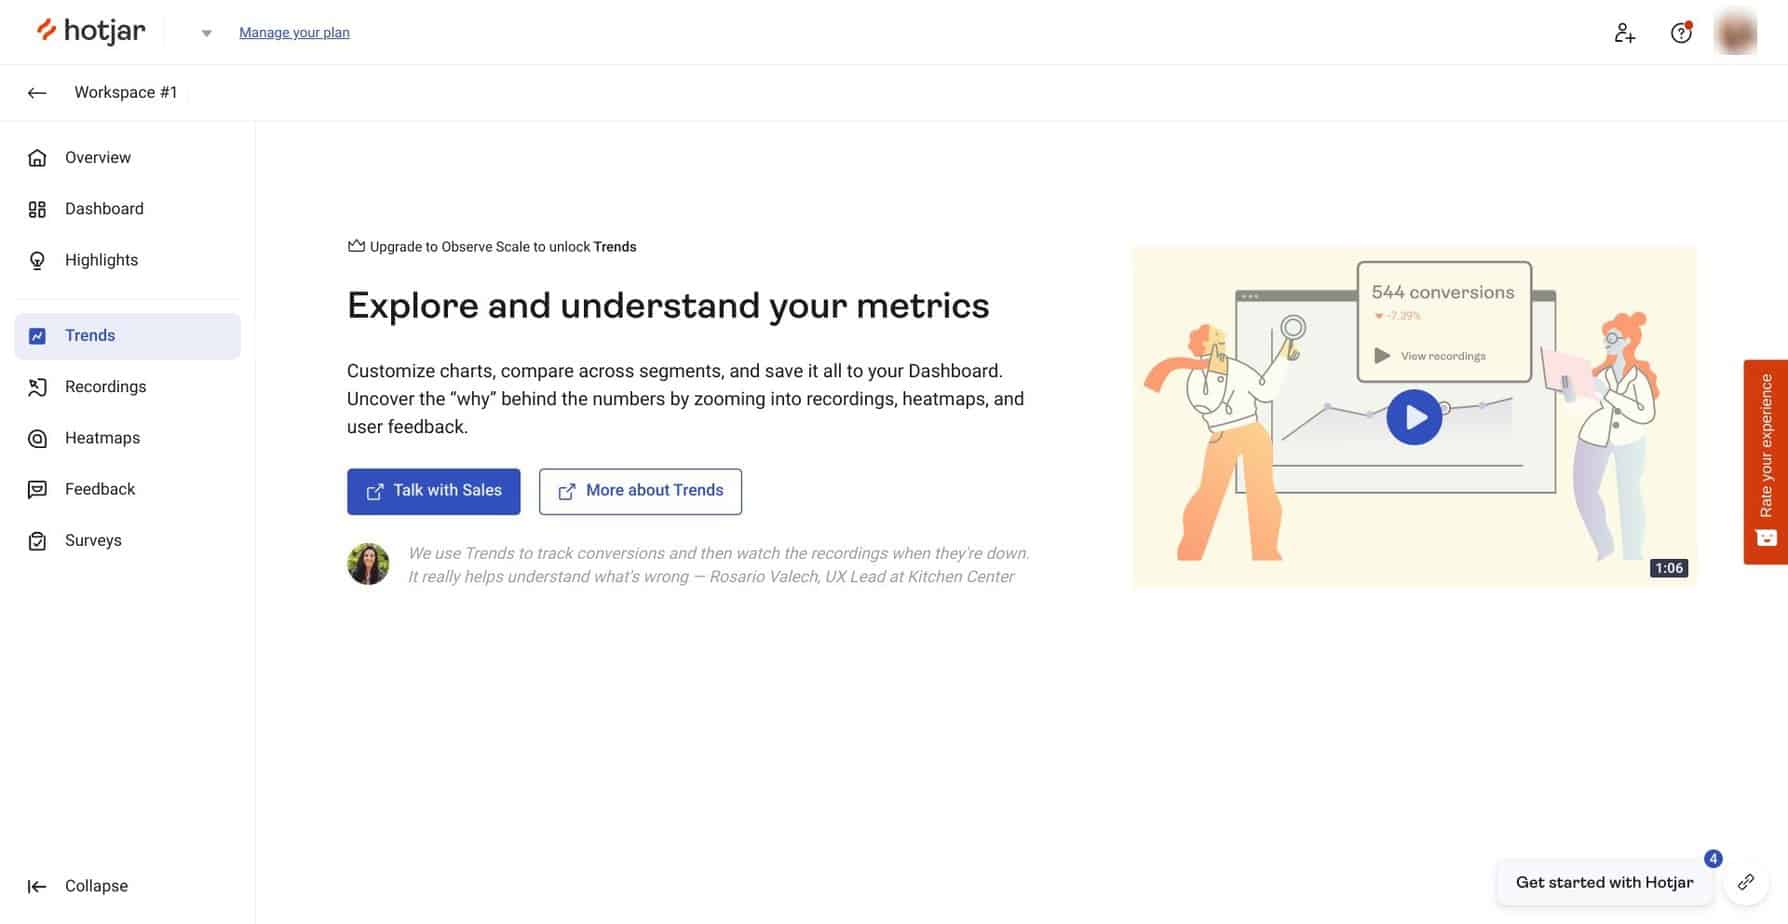
Hotjar is a heat-mapping tool. I like it because it’s surprisingly powerful for a free tool. It allows you to record real-time sessions to show how visitors are moving through your website. This is useful for a few reasons: you can identify when visitors are dropping off, for example, and consider how you can alter their experience to increase retention. You can also easily see which features visitors are using the most.
It also allows you to collect customer feedback using surveys, which is another helpful feature. You can easily insert it into your Webflow site by adding a tracking code to your website. There’s a paid subscription available, but the free tools are useful enough to give you some decent insights.
Features
- Heatmaps allow you to visualize visitor behavior.
- Live recording lets you get real-time insights into how customers interact with your website.
- It allows you to easily see which point customers drop off, allowing you to make changes to increase engagement
- Captures and collects data using surveys
- The free plan is robust, but there is a paid subscription available for deeper insights.
Ahrefs
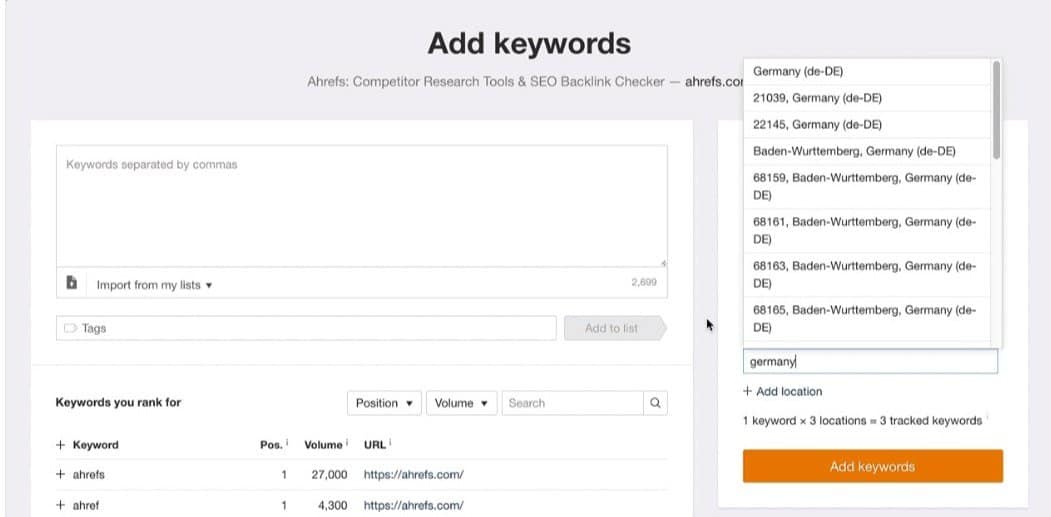
Ahrefs is a powerful SEO tool used by over 300,000 people worldwide. It has a range of tools, including keyword research, competitor analysis, backlink monitoring, and rank tracking. It’s easy to use, and it’s great for gaining insight into how your competitors are doing and analyzing their strategies to acquire more customers or visitors. I also like the Site Audit tool: this allows you to see any SEO-related issues on your website, which could improve your SEO ranking.
Ahrefs is fairly intuitive to use, and they offer a lot of support for new users, so they can learn how to use the platform properly. The downside is that you have to pay to use it, and the pricing plans are pretty big for smaller businesses or entrepreneurs. The data it provides is worth the price, however.
Features
- A customizable dashboard displays the metrics you want to see
- Research tools, including backlink trackers, allow you to observe competitor’s activities
- In-depth keyword research tool
- Content explorer brings up ideas for new web content
Nocodelytics
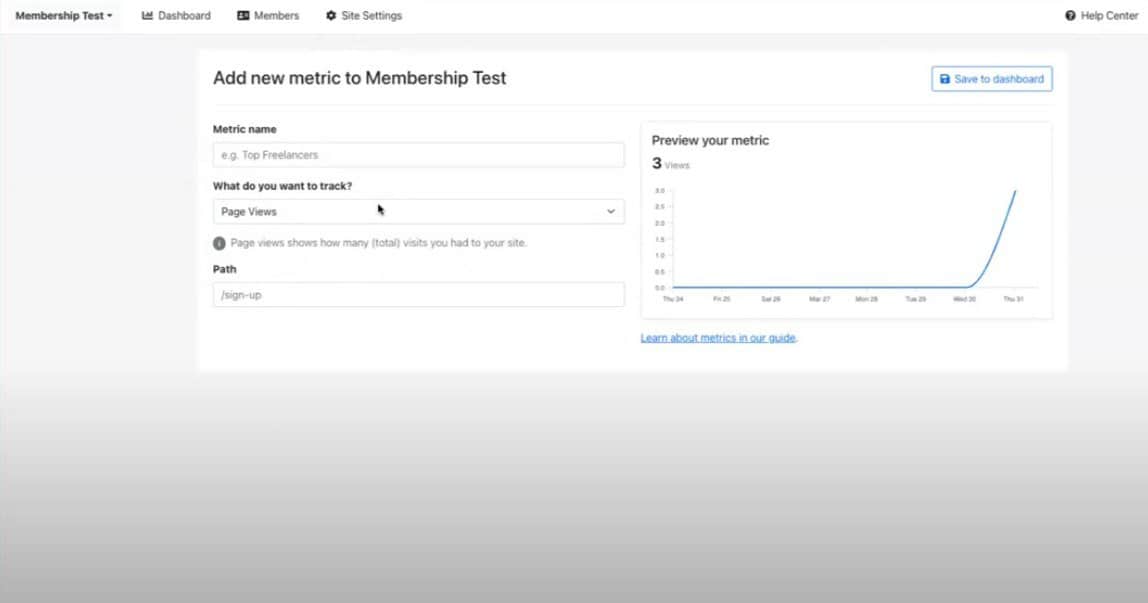
Nocodelytics is very easy to use with Webflow – you just need to copy and paste a section of code into your custom code section, and you’ll be good to go. It allows you to track metrics like searches, clicks, and more. If you want to understand why your customers are visiting your website and the content that they are looking for, it’s a great tool to use.
I like how easy it is to set up Nocodelytics. It’s also straightforward to understand, even if you’re entirely new to web analytics. They also offer a free plan, which allows you to track 3 sites, with 3 metrics for each. I’d recommend Nocodelytics to all kinds of websites, including blogs, online stores, and more.
Features
- Easy onboarding process
- Generous free plan for tracking simple metrics across multiple sites
- It allows you to see what your visitors are looking for
- Tracks clicks and page views
Meta Pixel
Meta Pixel (formerly The Facebook Pixel) is Meta’s advertising analytics tool. It gives you a piece of code to insert into your Webflow website, allowing you to measure the effectiveness of your advertising campaigns. In addition, it gives you a pretty good insight into customer behavior. It logs when someone takes an action (for example, adding an item to their basket or completing a purchase) and then sends this data to the Events Manager (the dashboard).
Meta Pixel is clever: it allows you to reach customers who have already connected with you via Facebook ads, which is great if you want to encourage customers to make another purchase. It’s also reasonably easy to install. So if you run Facebook ads, it’s worth setting up Meta Pixel. It doesn’t take long, but it may make running ads on Facebook much more profitable for your business.
Features
- It gives users excellent insight into the performance of their Facebook ads
- Allows users to reach out to previous customers using Facebook
- Easy to install
Optimizely
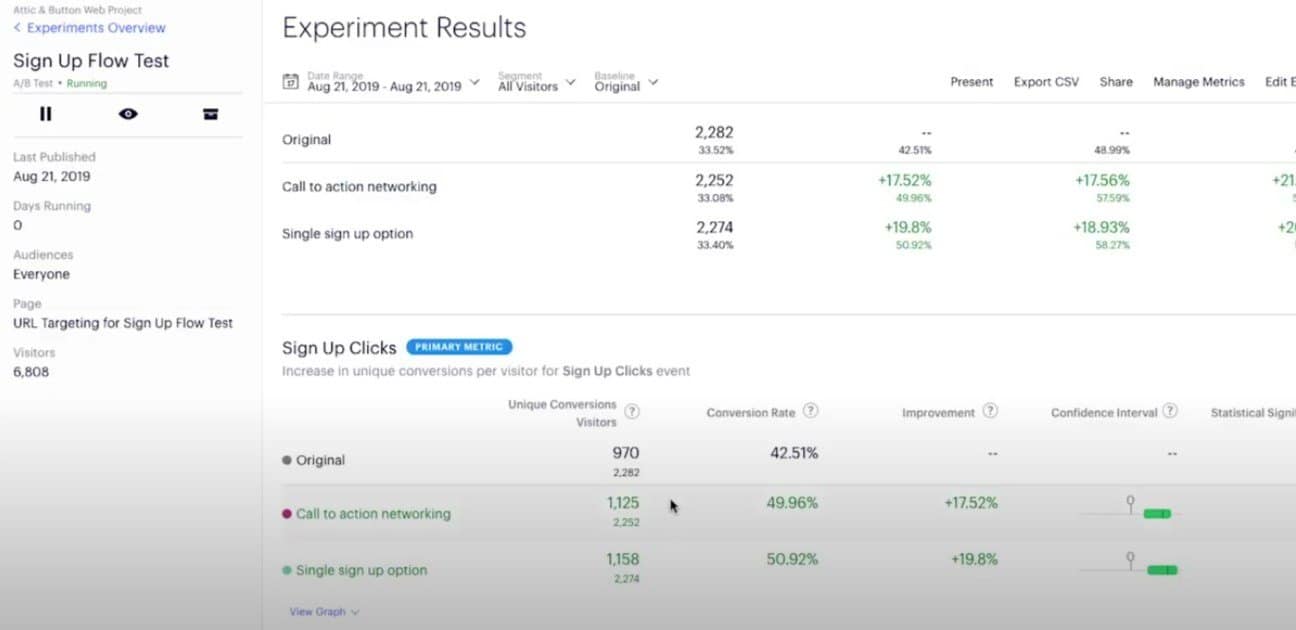
Optimizely is a split-testing (or A/B testing) tool that allows you to create two versions of one page on your website to track which one performs the best. You can optimize your website to increase engagement and conversion rates by testing these small differences.
I like the idea of running these small experiments. It takes some effort, of course. You can’t make each version of the page wildly different from the other because you won’t know which changes made the most difference. This fine-tuning can take some time, but it’s a powerful skill worth learning. Optimizely makes it easy to do this and to keep track of your tests, giving you a clear breakdown of the results in percentages so that you can spot the ‘winning’ page quickly.
Features
- Allows you to run ‘experiments’ to fine-tune your website
- Easy to install
- Works well with Webflow
- It has a free plan
Matomo
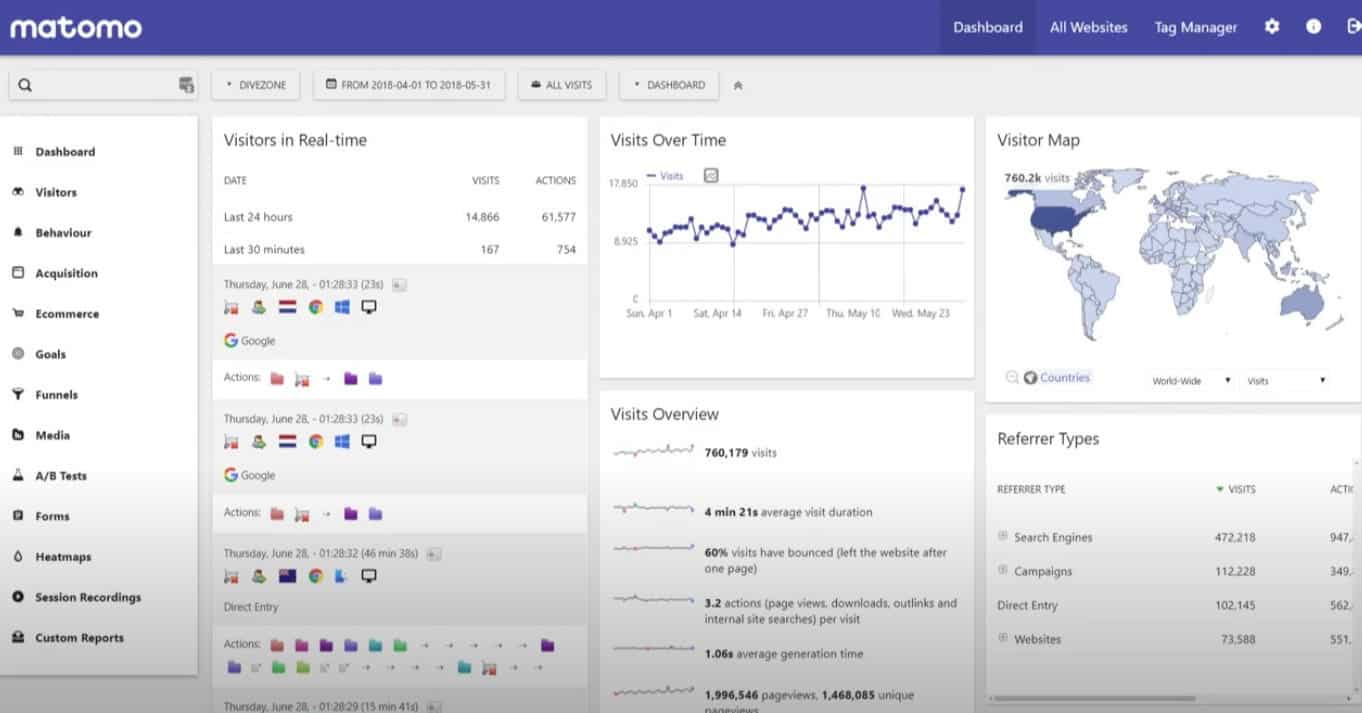
Matomo (formerly Piwik) is a good alternative to Google Analytics. It gives you real-time data analytics on metrics like page visits and goals triggered (like making a purchase). In addition, it has a customizable dashboard, so you can arrange the widgets to suit you. For eCommerce business owners, Matomo’s analytics are excellent.
I like the fact that you can set goals. For example, you can reach a certain profit or a specific number of people signing up for your services. This is a great way to encourage your business. Like Optimizely, you can run split tests (A/B tests) to optimize your website. They also have heatmaps to see which areas of your website visitors look at the most, as well as visitor maps, so you can see where in the world your visitors are coming from.
Features
- Excellent eCommerce analytics
- Allows users to set goals
- Offers split-testing
- Has heatmaps to track user’s website use
- Has maps to show where users are coming from
Google Tag Manager
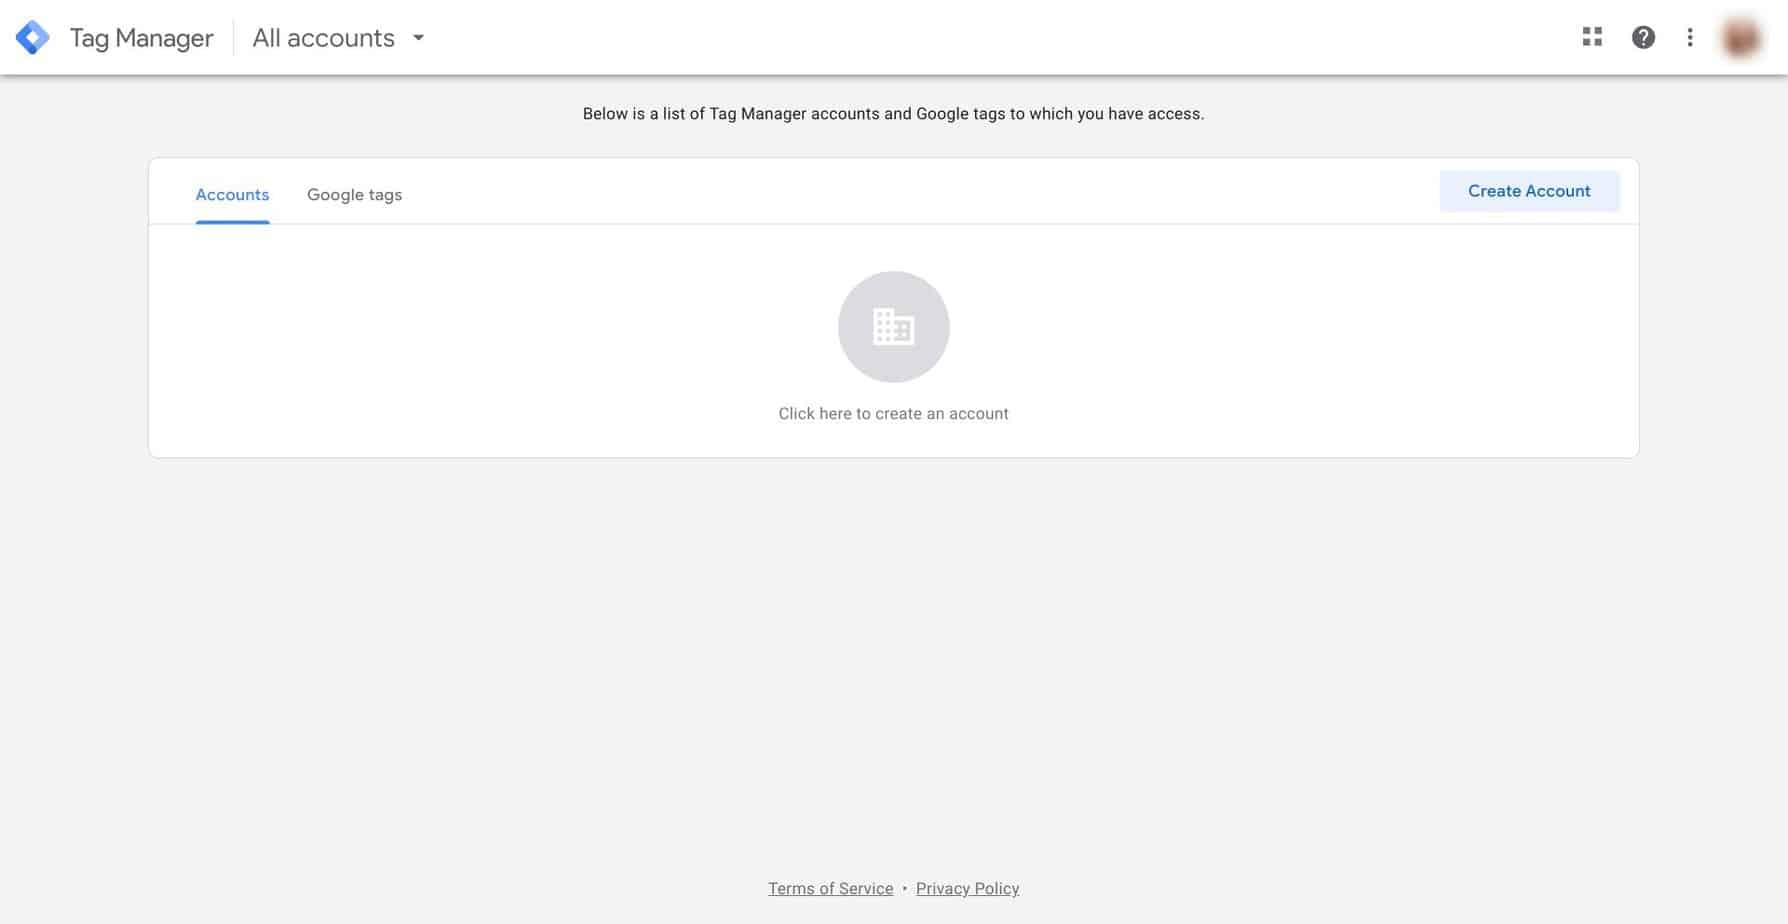
Google Tag Manager allows you to add marketing tags to your website. Simply put, these tags track certain metrics on your website without needing to alter the code. There’s a learning curve here, but it’s free, so I think it’s worth looking into it. In addition, you can customize the data that is sent to Google Analytics, allowing you to get specific about what you want to track.
For example, how many people click on a certain button when you’re running a new promotion? You can set up a tag, set the trigger (click this button, for example), and the data is sent straight to Google Analytics as soon as a customer or visitor performs that action. I like how specific you can get here, as it may allow you to monitor the performance of your marketing campaigns closely.
You can manage multiple tags on Google Tag Manager, so you can have several of them running at once.
Features
- Allows you to get specific about the data that is sent to Google Analytics
- Enables close monitoring of marketing campaigns
- Can run (and manage) multiple tags at once
FAQs
Question: Can I use plugins with Webflow?
Answer: Yes, you can use plugins with Webflow. Their plugin page gives you an idea of the kind of tools you can use to customize your website.
While Webflow is excellent as a platform, I’d recommend exploring plugins to optimize your experience.
Question: Why is it important to use an analytics tool?
Answer: Analytics tools are important for several reasons. The main reason is that the more information you have about customer/visitor behavior, the better decisions you can make in the future.
For example, knowing at which point customers tend to drop off your website is a very useful piece of information. It can be hard to understand your website from a customer point of view, especially if you’ve spent a long time building it. This data allows you to see your website from their perspective, and any annoying features/difficulties will be flagged up that you may have otherwise overlooked.
Question: Does Webflow itself have a free plan?
Answer: Yes, Webflow has a free starter plan, which is great if you want to test it out before committing to a paid plan. It doesn’t allow you to add custom code, however, which is something to keep in mind (a lot of the analytics tools in this list require you to add custom code to integrate into your website).
Question: Is Webflow good for eCommerce?
Answer: I would say yes, Webflow is a good platform for eCommerce. It allows you to sell products and is more customizable than other platforms (like Shopify – if you’re interested, you can read more about this in our Webflow vs Shopify comparison). In addition, combining Webflow with some good analytics tools will give you an excellent start to your eCommerce business.
Question: Can I add custom code to Webflow?
Answer: Yes, you can add custom code to Webflow depending on the price plan you have chosen. This makes it easy to allow analytics tools to collect data from your website.
My Final Thoughts
Hopefully, this has helped you to figure out which Webflow analytics tools will work best for you. With so many to choose from, it takes time to figure out where to start. If you want a basic idea of your website’s performance, Google Analytics is a useful service, especially for beginners.
Some of the other tools are worth looking at, too, particularly Optimizely for split-testing and Hotjar for a real-time look at how customers are using your website. These tools don’t take long to set up but could make a big difference in the long run.
Many of these tools have free plans, so it’s worth checking them out to see which one is best for you!

