
Last Updated on April 5, 2026 by Ewen Finser
Support leaders are sitting on more call data than they know what to do with.
The real issue is that most of it lives somewhere inconvenient: buried in disconnect reports, third-party add-ons, or spreadsheets that are already out of date by the time anyone reads them.
The knock-on effect is predictable. Coaching decisions get made on gut instinct, SLA breaches surface after the fact, and queue fires spread before anyone realises there’s smoke.
A call analytics dashboard pulls all of that scattered data into a single, real-time view so that supervisors can see what is happening across their team right now, not last Tuesday. The best ones go further, breaking down metrics like average handle time (AHT) at the agent level, flagging SLA risk before a breach occurs, and connecting call outcomes directly to customer satisfaction scores.
Let’s break down the best options for support ops managers and CX leaders, with a clear focus on what each platform does well, what it costs, and where it falls short.
Best Call Analytics Dashboards At a Glance
Platform | Best For | Pricing | AI Features | Analytics Depth | Tradeoffs |
Aircall | SMB & mid-market support teams | ~$30–$50/user/mo + add-on | Limited native AI; relies on CRM/helpdesk integrations for intelligent outcomes | Strong AHT drill-down, good FCR & CSAT, strong SLA/queue monitoring | Deep analytics cost extra |
Talkdesk | Enterprise teams needing deep customization & AI insight | ~$85+/user/mo | AI-driven CX analytics, interaction analysis, and resolution pattern detection across channels | Strong across all — AHT, FCR, CSAT, and SLA with custom alerts | High cost & implementation overhead |
Dialpad | Teams wanting AI-native live coaching | Mid-to-upper mid-market pricing | Live sentiment analysis, real-time AI coaching flags, and leaderboard-style agent visibility | Strong AHT & SLA visibility, good FCR & CSAT, lighter on correlation depth | Best features gated by higher tiers |
NICE CXone | Large enterprise with WFM, QA & compliance needs | Custom enterprise pricing | Suite-wide AI across WFM, QA, and intraday management; AHT updated every 15 minutes | Very strong across all — deepest option for AHT, FCR, SLA, and cross-functional CX reporting | Overkill for teams under ~100 seats |
CloudTalk | Growing teams wanting practical dashboards | Mid-market pricing | Sentiment analysis and conversation intelligence to help explain CSAT trends | Strong AHT & SLA, good FCR & CSAT with sentiment analysis, lighter integrations | Less depth than Aircall, Talkdesk, or NICE |
How I Chose the Best Analytics Dashboard Platforms

There is no shortage of platforms with a built-in dashboard, and a list of every single one would not be particularly useful to anyone making a real purchasing decision.
What actually matters is which platforms surface the metrics that support leaders rely on every day, and which ones make you work too hard to find them.
To narrow the field, I evaluated each platform against the six KPIs that came up most consistently in conversations with support ops managers and CX leaders:
- Average Handle Time (AHT)
- First Call Resolution (FCR)
- Customer Satisfaction Score (CSAT) correlation
- Service Level Agreement (SLA) compliance tracking
- Queue performance visibility
- Agent-level reporting depth
Any platform that could not demonstrate clear, accessible reporting across all six did not make the cut.
Why Call Analytics Dashboards Matter for Support Teams
Any support team that’s flying blind when it comes to metrics isn’t just being inefficient, but also very costly.
Queue spikes go unnoticed until they peak, agents who need coaching keep running the same playbook, and SLA breaches only get flagged in the post-mortem when the damage is already done.
The right call analytics dashboard changes that dynamic. Real-time queue visibility, for instance, allows supervisors to shift staffing before a backlog has a chance to form rather than reacting to one that already has.
AHT broken down at the agent level (into talk time, hold time, and after-call work) makes coaching conversations far more specific and actionable than a team average ever could. CSAT correlation across call types helps identify which interaction categories are driving satisfaction up or down, which is the kind of insight that is very difficult to piece together from a weekly export.
In my experience, the platforms that consistently deliver this level of operational visibility tend to share one important characteristic: the analytics sit inside the same system that handles the calls, with no third-party data pipeline sitting in between.
What To Look For in a Call Analytics Dashboard
Before committing to any platform, it is worth knowing which features separate a genuinely useful dashboard from one that looks impressive in a demo but frustrates you in practice.
Metric depth across the core KPIs: AHT should be broken down into talk time, hold time, and ACW rather than presented as a single average. FCR should be configurable to your team’s definition of resolution, not inferred by the platform on your behalf.
A clear split between real-time and historical reporting: Real-time dashboards tell you what is happening right now. Historical reporting helps you understand the patterns behind it. The best platforms do both well rather than sacrificing one for the other.
Configurable SLA thresholds: Your team’s SLA target is unlikely to match whatever default the vendor has baked in. If you cannot set your own threshold, every SLA report you generate is being measured against someone else’s benchmark.
Agent-level granularity: Team averages are useful for a high-level view, but they can easily mask both standout performers and those who need intervention. A good dashboard should make it straightforward to drill down to the individual level without requiring a separate report.
CRM integration depth: Call outcomes should connect directly to CRM records so that managers can cross-reference satisfaction scores, call type, and agent performance without manually reconciling data across systems.
With those criteria in mind, here is a breakdown of the best call analytics dashboards available right now and how each one measures up.
1. Aircall Analytics+
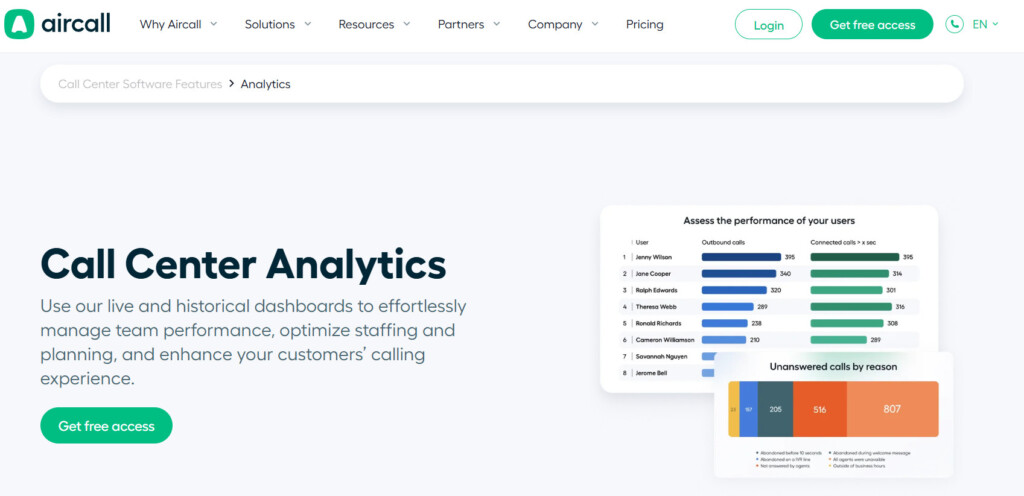
I’ve led with my favorite choice, as Aircall’s core analytics are structural. In other words, the analytics sit inside the same platform that manages your calls. This means as data pipelines go, this is as short as it gets.
The Overview+ dashboard tracks SLA compliance via the ‘Inbound’ tab. From here, you can configure time thresholds and carry out team-level filtering.
AHT isn’t just a simple average number: it’s broken down into in-call time, hold time, and ACW, making it much easier to have specific coaching conversations.
For support teams, the CSAT correlation story runs through the CRM integration layer. Aircall supports over 250 connectors natively, so call outcomes can land in the likes of Salesforce and Zendesk automatically. I’ve seen first-hand how this makes it much easier for managers to cross-reference satisfaction scores with call type and agent performance without manual exports.
Pricing starts at $30/license/month for the ‘Essentials’ plan. Analytics+ is $15/license/month extra, and AI assist (for auto-generated call summaries) is $9/license/month. The ‘Professional’ plan ($50/license/month) includes both advanced analytics and AI Assist.
Pros and Cons
- AHT is broken down into talk time, hold time and ACW separately.
- SLA reporting in the analytics dashboards lets you configure an inbound threshold and measures performance against it. (Excluding time spent in IVR prompts or with the AI Voice Agent)
- Native phone system analytics (no third-party data pipeline)
- AI Assist can auto-generate call summaries to reduce ACW time.
- Analytics+ is a paid add-on ($15/license/month) on top of base ‘Essentials’ plan
- Historical data depth tied to plan tier
- Not ideal for very large enterprise contact centers.
2. Talkdesk CX Analytics
I’d say that the best way to describe Talkdesk’s analytics is that it sits inside its broader ‘Customer Experience Automation’ platform. In other words, info like interaction data, transcript analysis, and performance metrics share the same data layer.
I found the real-time dashboard very impressive, not least because it’s fully customizable with alert thresholds. This ties in with the importance of proactive SLA notifications that we discussed earlier.
Special mention should also go to Talkdesk’s CX Insights module, as it can analyze customer interactions across various channels to see which are driving CSAT rather than just generate a raw list of numbers.
The trade off is complexity and cost. Even the lowest-priced ‘Digital Essentials’ tier is $85/user/month. This includes real-time dashboards but it’s limited to digital channels, so you’ll likely have to pay extra for more in-depth analytics.
Pros and Cons
- AI-powered interaction analytics with tools to analyze CSAT and resolution patterns across call types
- Customizable dashboards with threshold alerts
- Strong enterprise CRM and CCaaS integration ecosystem
- Enterprise-tier pricing
- Full analytics requires higher paid plans
- More complex implementation for customized deployments
3. Dialpad Analytics
The first thing that struck me when I demoed Dialpad with a client was that its features are genuinely AI-native instead of just AI adjacent. Once supervisors have come to grips with it, that means they can use features like the live sentiment scoring during a call to identify interaction issues before it ends.
Aside from not having to lean only on the post-call report, you also get SLA tracking with configurable thresholds.
The agent leaderboard’s also a great coaching tool, as it clearly lays out call volume, AI-flagged moments and sentiment scores side-by-side. My main complaint was that CSAT correlation wasn’t as detailed as other platforms I trialled, like Aircall and Talkdesk.
Pros and Cons
- Real-time AI transcription and live sentiment tracking within the dashboard
- SLA tracking with configurable thresholds and short-abandoned call exclusions
- Agent leaderboards can track call volume and sentiment, with AI recommendations
- CSAT correlation isn’t as in-depth as some competitors
- Advanced reporting requires higher-tier subscriptions
- Learning curve for supervisors who are new to AI-native dashboards.
4. NICE CXone Mpower
After tinkering with this platform I can safely say that it sets the standard for what enterprise analytics can look like. The real questions are whether you need its depth of capability, and if you have the necessary specialist configuration abilities and resources to get started.
The dashboard architecture is role-based: agents, supervisors, and executives can each see a view calibrated to their scope, with drill-down into interaction-level for any of the aggregated metrics.
The 26.1 release (available as of Feb 2026) has also added daily AHT visibility directly in the platform’s “Intraday Manager”.
If you’re running a larger contact center, then NICE Workforce Management (WFM) integration could be a dealbreaker. Its SLA and ASA forecasts can account for concurrent chat handling and workload complexity. This can often produce more accurate staffing models than simpler forecasting systems.
Pros and Cons
- One of the most comprehensive analytics suite in this roundup (AHT, FCR, CSAT, SLA, WFM, & QA in one platform)
- Role-based dashboards for agents, supervisors, and execs with drill-down
- Daily AHT visibility in Intraday Manager (as of 26.1 release)
- Enterprise-level pricing and implementation requirements
- Very complex for smaller teams (<100 seats)
- Configuration and customization likely require specialist resource
5. CloudTalk
If I was awarding medals I’d pin one on CloudTalk’s lapel for having a dashboard for covering the core six metrics clearly and cleanly. The platform’s also customizable enough for mid market teams that don’t need enterprise complexity.
I’m especially fond of its sentiment analysis, which can cross-references topics with negative sentiment across transcripts. That helps turn CSAT scores into something a little more actionable than plain figures.
Pros and Cons
- Real-time dashboard with AHT, queue wait times, CSAT, and agent performance
- Sentiment analysis and transcript insights that help explain CSAT trends
- Solid FCR and SLA reporting (supports advanced filtering)
- Analytics depths not as sophisticated as competitors like NICE CXone
- Certain advanced reporting features limited to more expensive plans
- Smaller integration ecosystem than Aircall enterprise CCaaS platforms
How to Choose the Best Analytics Dashboard for Your Support Team
Choosing a call analytics dashboard is ultimately a question of what kind of support operation you are trying to run, and how much visibility you need to run it well.
For teams where AI-native coaching and live sentiment visibility are a priority, Dialpad is purpose-built for that use case. Talkdesk covers similar ground at the enterprise level with stronger cross-channel CSAT intelligence, but brings a cost and implementation commitment to match.
NICE CXone Mpower sets the standard for larger contact centers that need analytics spanning WFM, QA, and compliance in one place. CloudTalk is the practical mid-market choice: clean, focused on the core six metrics, and free of the overhead that comes with a full enterprise suite.
The recommendation I find myself returning to most often for support ops managers in the 11 to 100 seat range is Aircall Analytics+. Not because it outscores every competitor on every dimension, but because the thing that matters most in operational analytics (data you can trust) is baked into the architecture.
When the analytics live inside the same system handling the calls, there is no pipeline to break, no reconciliation to do, and no lag between what happened and what the dashboard shows. For a support leader trying to make faster, better-informed decisions, that reliability is everything.